The grid-based hazard calculations in the Hazard Assessment app were discussed in a previous post. The Iso View describes the hazard at all locations within the mine but when you are considering the seismic risk for a particular work area, large events and strong ground motions may come from multiple sources. The Excavation View estimates the seismic hazard associated with working areas (minode locations) in a few different ways as described below.
P [ ML within R ]
The P [ML within R] marker style is the probability of exceeding the design magnitude within the design distance (R) of the minode location (per year). This is the simplest minode hazard estimate and you will notice the other marker styles take a bit longer to calculate because they include more complex ground motion (PPV’) calculations.
As discussed in a previous post, the grid-based hazard calculations result in a probability of exceedance assigned to each grid volume. So, for a design magnitude of ML2, the annualised probability of exceeding ML2 within each grid cell volume is computed. To compute the probability of exceeding ML2 within R of a minode, the exceedance probabilities for all the grid cells within R are integrated together.
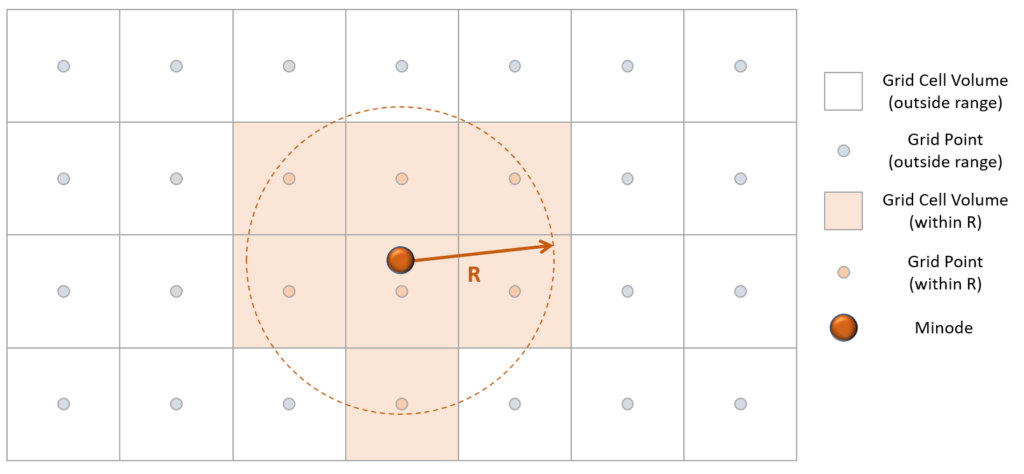
In the 2D example below, there are seven grid cells within R of the minode. Let’s say each of these grid cells has a probability of exceeding ML2 of 1 %. Then, the probability of exceeding ML2 within R of the minode would be:
P [ML2 within R] = 1 – (1 – 0.01)7 = 6.8 %
The hazard for a single minode doesn’t help you much. You really want to know the hazard for the whole mine or for any possible work area. To compute the probability of exceeding ML2 within R of multiple minodes, you just integrate all the grid cell probabilities within R of any minode. This is illustrated below for a tunnel length with three minodes. Each grid cell is only counted once. In the hazard app, the footer of the Excavation View shows the P[ML within R] for all minodes. You can also use the selections tool to select any combination of minodes and the integrated hazard will be shown in the footer. The Volume Hazard tool calculates the P[ML within R] for any minode within each of your filter volumes.

As you can see from the illustrations above, the grid cells that are included “within R” are based on the distance to the grid centre point. This is why we recommend using a value for R that is larger than the grid spacing you are using. If you specify R much less than the grid spacing, you may see some odd artefacts where some minodes have much fewer grid points associated than others.
Ground Motion Hazard
The other minode marker styles in the Excavation View express the hazard based on the probabilistic strong ground motion (PPV’). As discussed in the last blog post, a Strong Ground Motion relationship is required to calculate the probability distribution of PPV’ based on the event source details and R. For each minode, the ground motion hazard, P[PPV’], is the probability of exceeding the design PPV’, anywhere within the volume associated with the minode (the tunnel section, per year).
For each minode, there is a probability of exceeding the design PPV’ due to a large event occurring within any particular grid cell. To compute P[PPV’] for a minode, each grid point must be considered and the probabilistic contribution of each integrated together. The grid cells closest to the minode (smallest R) are the most likely to contribute the most to the minode P[PPV’] but high hazard grid cells will have a larger zone of influence because of the potential for very large events.
The grid-minode combinations with a very small P[PPV’] are ignored in the analysis to speed up the calculation. The minode P[PPV’] is calculated from the remaining grid point combinations. For each minode, the threshold probability to ignore a grid point can be specified from the control panel. Increasing the threshold is slightly less accurate but will increase calculation speed.
The P[PPV’] for each grid-minode combination is computed by discretising the magnitude, distance and PPV’ probability distributions. From the grid-based seismic hazard calculations, the magnitude distribution is known and the probability of each magnitude bin of large events can be calculated. Then, the distance from the grid cell to the minode volume is represented by the R distribution in a similar way to the figure below.
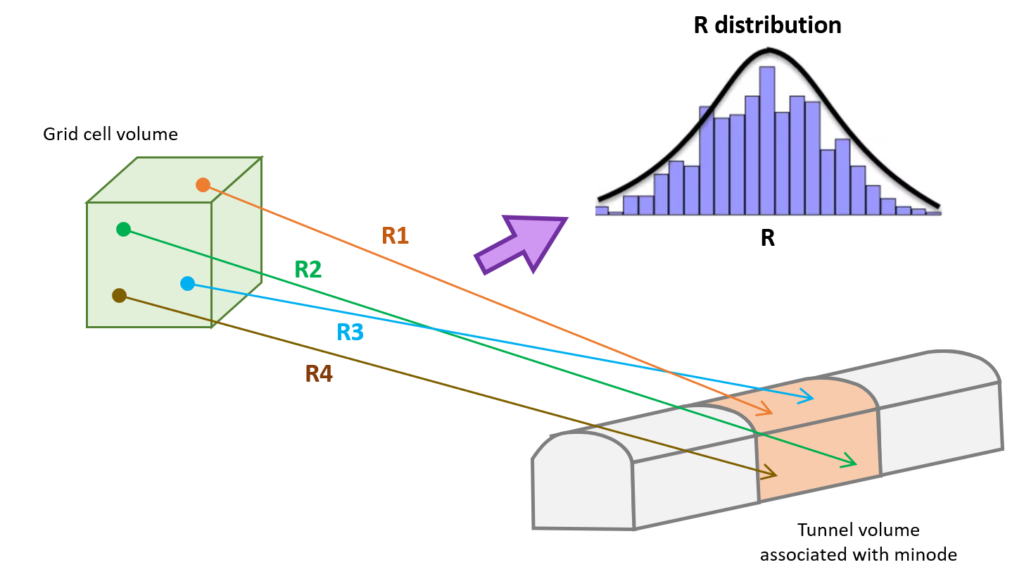
From every combination of ML and R bin, the strong ground motion relationship is used to calculate the full PPV’ probability curve for the minode. Only the magnitude bins that can possibly result in a PPV of interest are included in the calculations. This is controlled by the PPVmin control parameter. The PPV’ probability curve is plotted above PPVmin. The P[PPV’] can be quickly calculated for any design PPV’ values above PPVmin from the probability curve.
Note the example PPV’ probability curves in the figure below. The RED line is the probability curve for a single minode but as with the P[ML within R] calcs discussed above, you will often want to evaluate larger tunnel areas, or even the whole mine (BLUE). The PURPLE line is the probability curve for a small section of tunnel with multiple minodes and indicates the yearly probability of exceedance for PPV’ anywhere along that tunnel section. The GREEN line is the probability curve for the whole mining level.
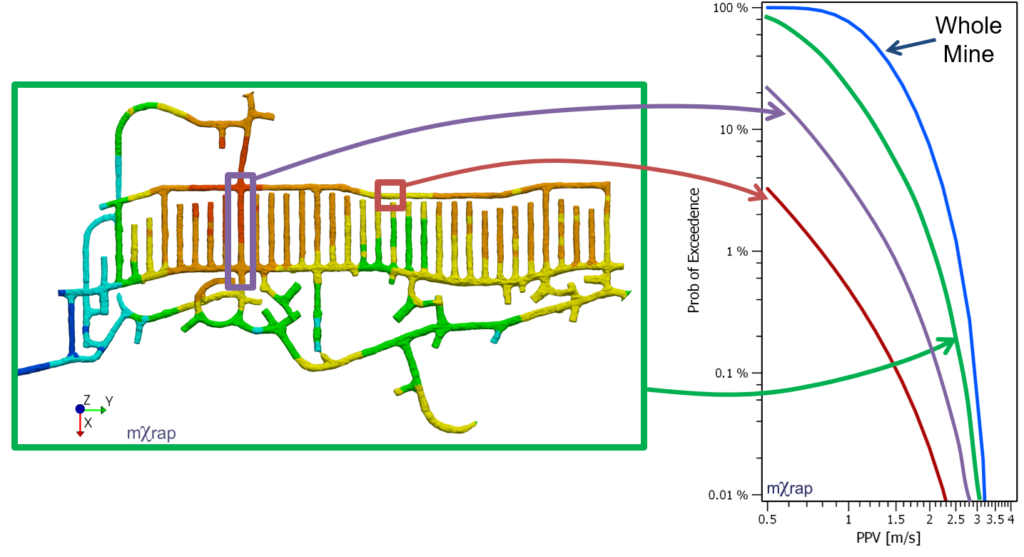
Clearly the probability of exceedance will tend to increase as longer sections of tunnel are considered. So, even though the P[PPV’] for a single minode is small, the accumulated hazard when considering the whole mine can be much higher. This is why the hazard app displays the ground motion hazard in a couple of different ways other than the individual minode P[PPV’] to make the hazard ratings more intuitive.
Equi-probability zones
The equi-probability zones marker style is a simple ranking of minodes from lowest to highest P[PPV’]. The marker style value is a percentile rather than a probability. For example, let’s say you have 100 minodes, the top 5 minodes with the highest hazard will be red (0.95-1.00). The next top 5 (6-10) highest hazard minodes would be orange (0.9-0.95) etc.

Note that the equi-probability zones do not illustrate an absolute hazard rating, rather illustrates relatively low hazard areas and relatively high hazard areas. There may be cases where the top 5% of minodes are actually low hazard. Conversely, the bottom 5% minodes may still be quite a high absolute hazard. The PPV probability chart plots the curves for each equi-probability zone.
Cum P[PPV]
The Cumulative P[PPV] marker style also ranks minodes from lowest to highest P[PPV’] but the marker values are probabilities accumulated from lowest to highest. As described previously, to accumulate the hazard for multiple minodes, the probabilities are integrated together. For example, if your have four minodes with individual P[PPV’] of 1%, 2%, 5% and 7%, then the probability of exceeding the design PPV’ AT ANY of the four minodes is:
P[PPV’] = 1 – (1 – 0.01)(1 – 0.02)(1 – 0.05)(1 – 0.07) = 14.3 %
The Cumulative P[PPV] marker accumulates the probabilities in the same way, one at a time, from lowest to highest hazard. So for example:
- The lowest hazard minode has the same individual P[PPV] and Cum P[PPV].
- The second lowest hazard minode has a Cum P[PPV] equal to the combined hazard for the two lowest minodes.
- The minode with the median individual hazard has a Cum P[PPV] equal to the combined hazard integrating all lower 50% of minodes.
- The highest hazard minode has a Cum P[PPV] equal to the accumulated hazard for all minodes.
The Cum P[PPV] marker has the benefit of showing both the cold-to-hot scale of all minodes as well as an indication of the absolute hazard.
Prob Class
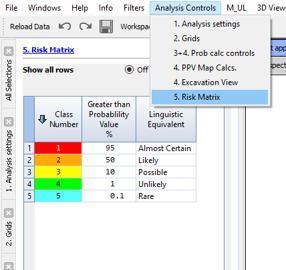
The Probability Class marker style is similar to the Cumulative P[PPV] marker style, except you can specify your own colour scale and classes and give them a name. This can help to communicate changing hazard areas to operational personnel.
You can see the classes in the risk matrix. You should notice that the Cum P[PPV] corresponds to Prob Classes according to the numbers in that matrix.
For more details on the ground motion hazard calculations see Wesseloo (2018).