

Data Anomaly Detection
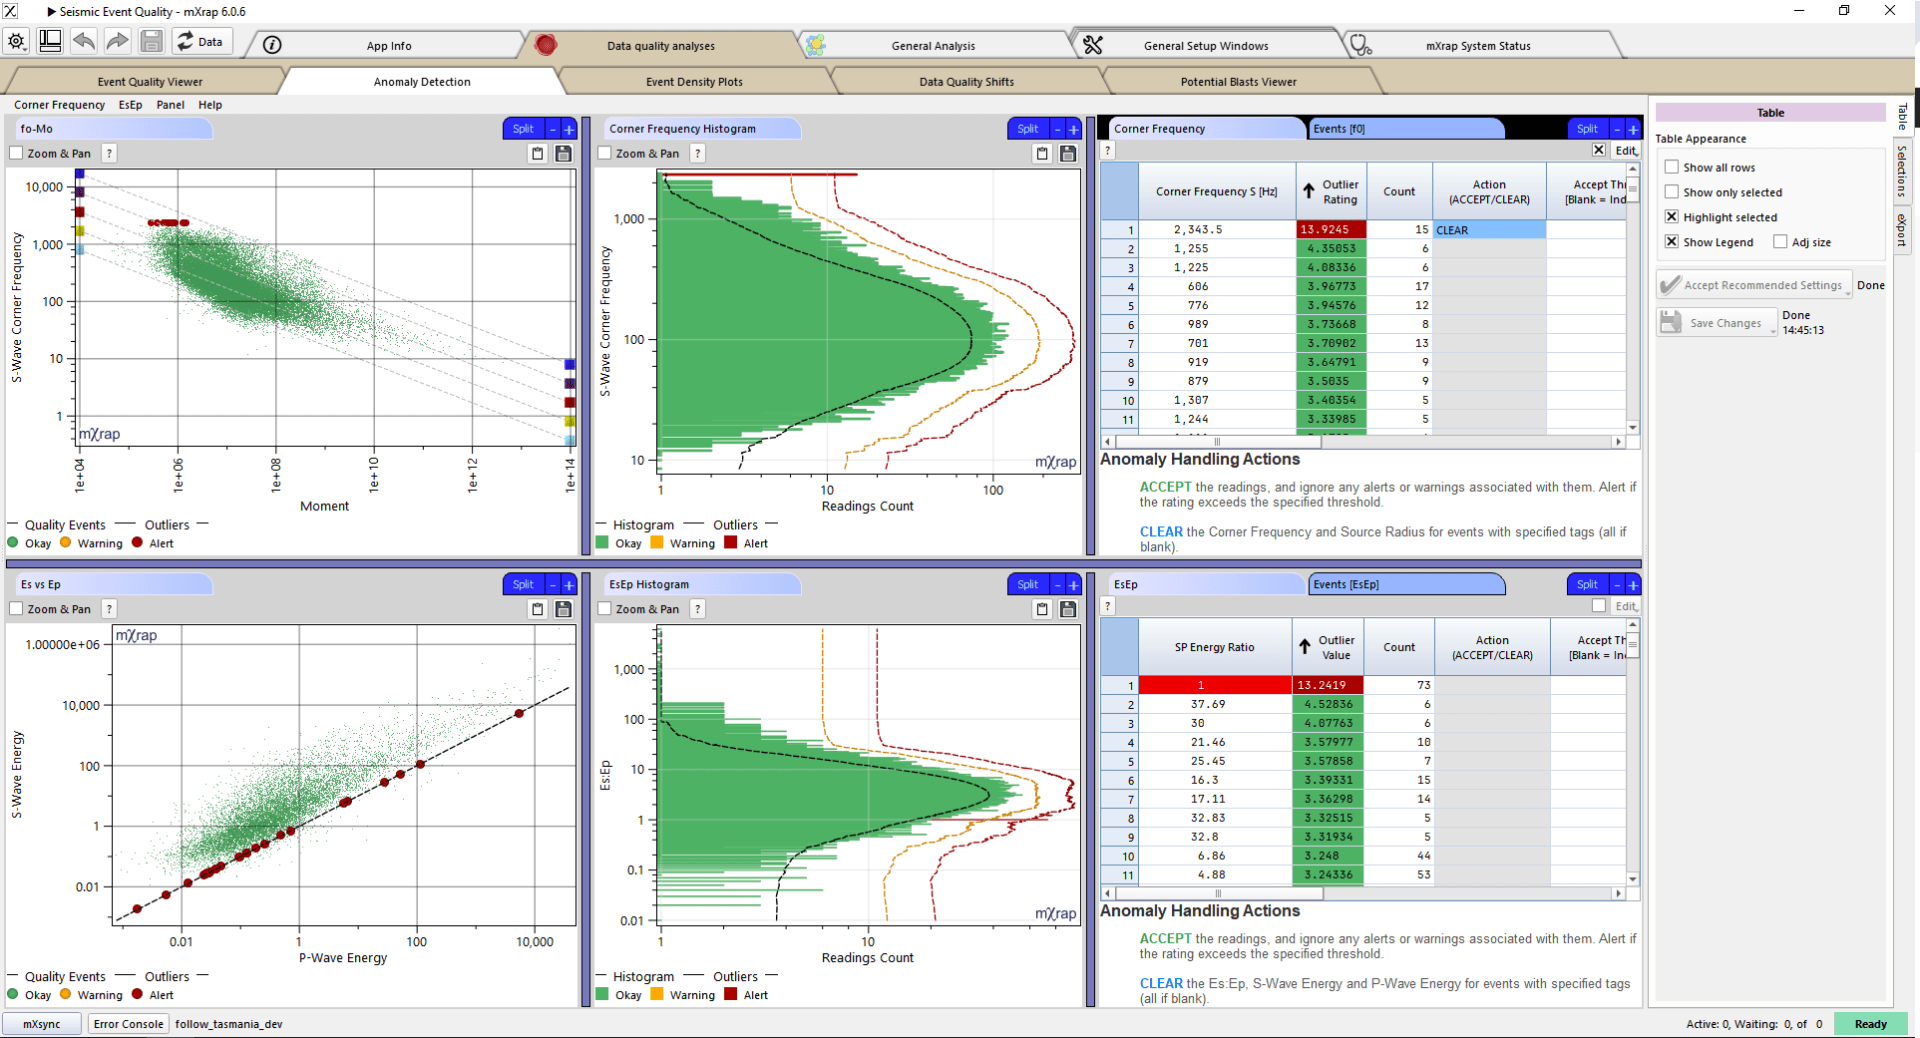
Anomalies often stem from default values, null entries, manual input or rounding mistakes. While many of these anomalies indicate bad data, not all do. However, if any data is found to be incorrect, it’s important to clear these values to prevent skewing your analysis. Our new Anomaly Detection window provides visualization tools to help you investigate any flagged anomalies and take appropriate action.
Hazard Assessment – Event Rate

The Hazard Assessment application uses a grid-based approach to describe the seismic hazard throughout your mine. Each grid point essentially represents a seismic source with a specific frequency-magnitude relationship. A frequency-magnitude relationship is defined from the MUL, Mmin, b-value, and event rate. The event rate is something we haven’t taken a dive into yet, so we’ll get into it in this post. Event rate sounds like a simple calculation but there are quite a few complexities worth explaining.
Inspections and data entry app

We are excited to announce our new inspections and data entry app. This app is a general-purpose data entry app designed for offline use with tablet devices which can be customised to fit each site’s exact needs. The app allows simple and fast input of multiple data types (selection, text, numerical inputs, orientation etc.) as well as attaching photos and sketches to reports.
Export Panel for 3D Views, Charts and Tables
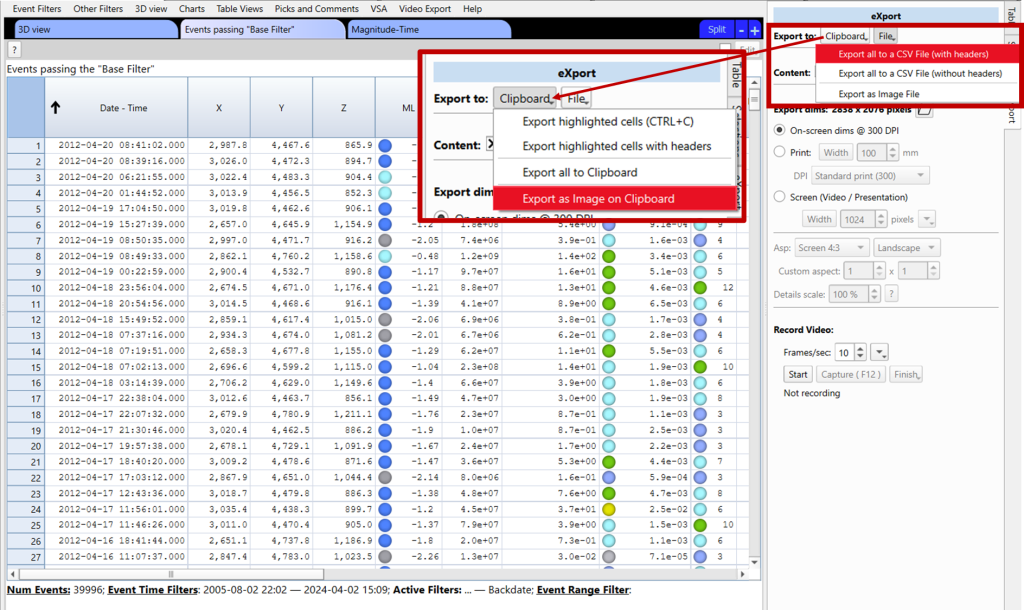
The export panel, located on the right-hand side of 3D views, charts and tables, can be used to generate images, files, and videos with just a couple of clicks. This panel is particularly useful for preparing presentations and papers that require figures with specific dimensions or font sizes. Use the ‘Export dims:’ functions to create […]
mXrap Version 6 – User Change Logs

We’re pleased to announce the release of mXrap version 6, bringing with it a range of enhancements to elevate your mXrap experience. This major update includes improvements to the user interface, as well as enhancements to speed when loading the root folder and applications. Additionally, we’ve upgraded the 3D rendering and navigation capabilities in the […]
Modifying The Blast Record
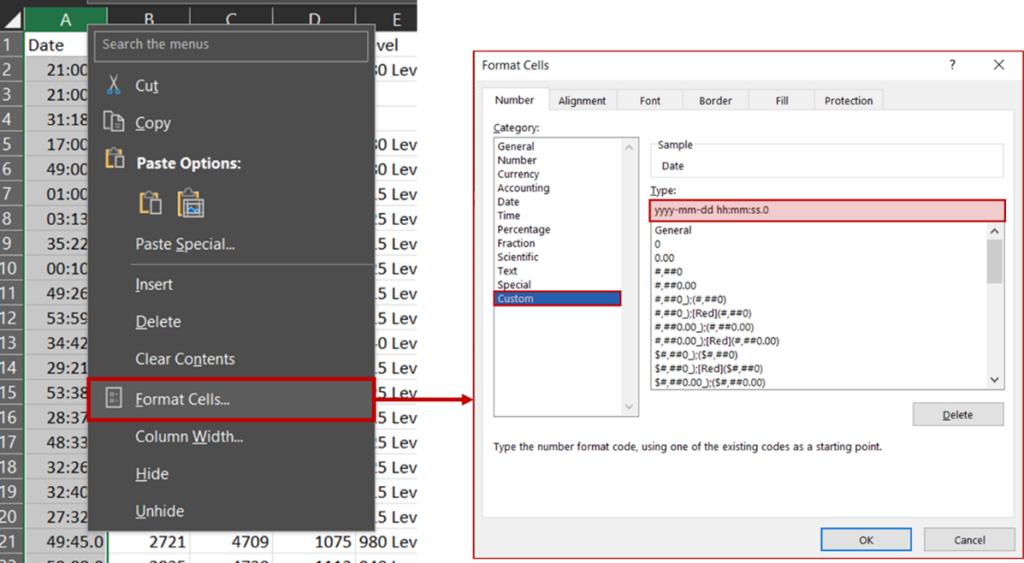
When trying to add, delete or change blasts in mXrap, best practice is to use the ‘Blasts Editor’ found under the ‘General Set-Up Windows’ tab: If you need to make bulk changes however, it may be tempting to directly alter the input file in the root folder. Problem: When you open the ‘Blasts.csv’ in MS […]
RMDA app: new geotechnical domains delimiter app and more!
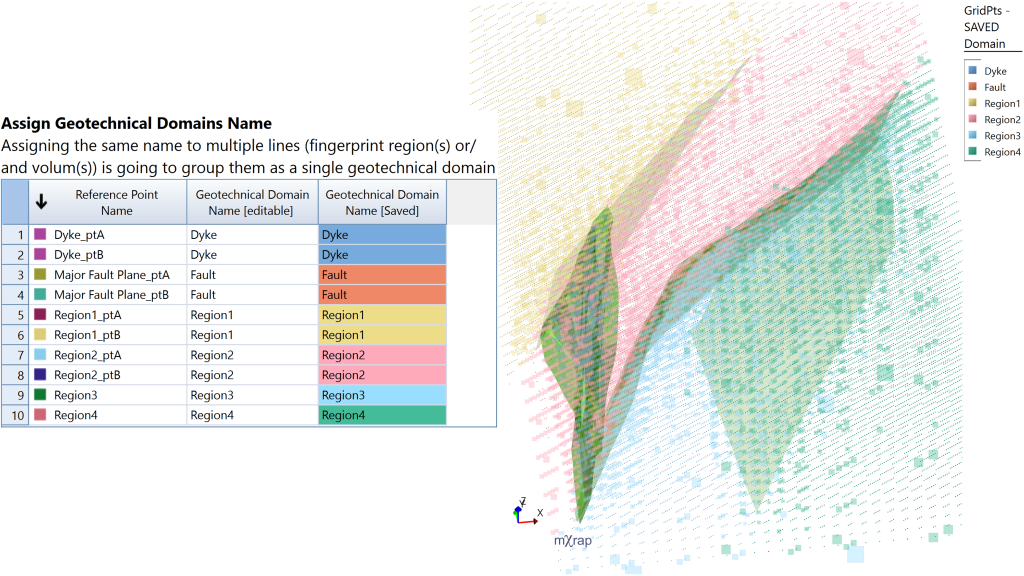
A new app has appeared in the Rock Mass Data Analyser suite: the Geotechnical Domains Delimiter. This app allows you to create your own geotechnical domains; either from boundaries (e.g. lithological contacts or fault planes) or volumes (e.g. lithologies, domains, selection boxes). The app uses the HW/FW filter to classify the space in relation to […]
Sensitivity Analysis in Hazard Assessment app

A new window has been added to the Hazard Assessment app (Figure 1). The sensitivity analysis aims to quantify the effect of the variation of the input parameters on the hazard. These analyses can also help the user to determine the optimal settings to use for many of the parameters. This window allows the user […]
Updates to Short-term Response Analysis

There have been a number of recent updates to the Short-term Response Analysis app. These include: Chart for determining re-entry using different parameters: This chart gives you values for a particular parameter over time (based on a user-defined time window size and step). A threshold value for that parameter can be set, allowing you to […]
HW–FW filter
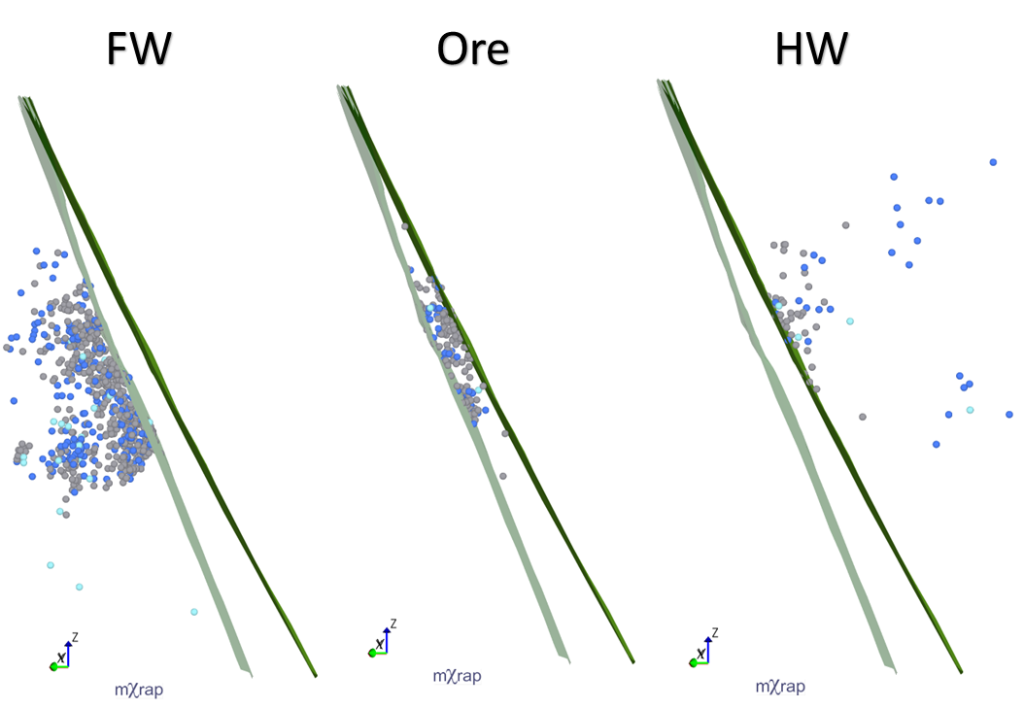
For a few months now, a new tool has appeared in the General Analysis app; the hanging wall (HW) and footwall (FW) filter. The HW–FW filter allows you to filter your events based on where they are in relation to ticked survey/s. If more than one survey or plane is used for the HW–FW filter, […]
