The Iso View in the Hazard Assessment application expresses the seismic hazard in two ways.
- The current yearly hazard within the chosen grid volume. This is shown in the footer of the 3D view, as the probability of an event exceeding the design magnitude.
- The spatial distribution of the hazard. This is highlighted by the hazard isosurfaces.
In the case below, the design magnitude is set as ML2. The corresponding hazard isosurfaces for ML2 can be interpreted as the most likely location for that event to occur.
The ML rating essentially delineates the areas of the mine from lowest to highest hazard. The volume bounded by the ML2 isosurface indicates the ML rating is above ML2. Note that the colours in the legend are slightly different than the isosurfaces’ apparent colour in the 3D view. This is due to transparency effects and viewing multiple transparent surfaces on top of one another.
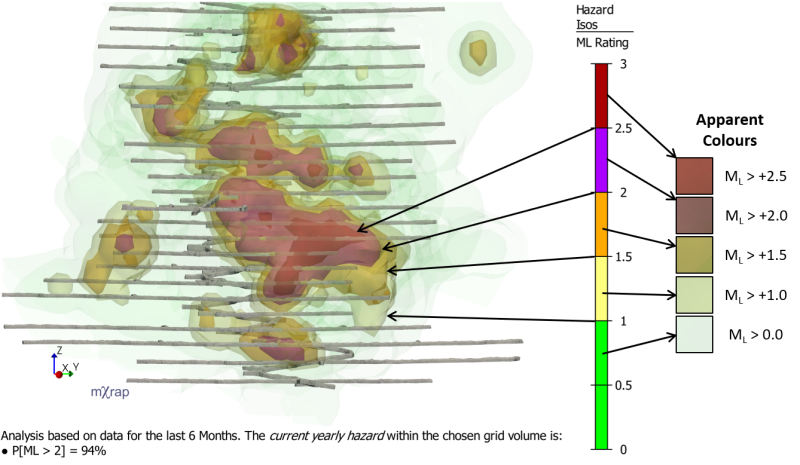
It is important to note that while the data period can change (6 months in the example above), the hazard calculations are all referring to the yearly hazard. This is a simple matter of normalisation. E.g. if you record 100 events in an area in six months, this area is assigned an activity rate of 200 events per year.
The use of yearly hazard is to help interpretation. Reducing the time period used in the definition reduces the probabilistic hazard and this can be misleading. For example, let’s say you give your mine manager a report every day and it says that based on recent data, the probability that we will experience an event in the next 24 hours over ML2 is 0.77%. You do this every day for a year and each day, the mine manager looks at the number and thinks, “Hmm, 0.77%, that’s pretty small, risk is pretty low”. A daily hazard of 0.77% is the same as the yearly hazard in the example above.
1 – (1 – 0.0077)365 = 94%
The mine manager may interpret the risk more accurately when presented with the same hazard but expressed for a hazard period that is more intuitive.
The current yearly hazard displayed in the footer of the 3D view applies to the entire volume of the chosen grid. We also compute the yearly hazard in the VTM table in General Analysis. So, you might reasonably assume that if you specify a volume in General Analysis the same as the grid volume in the Hazard app, the two numbers should match. In fact, while the probability of exceeding ML2 is 94% in the example above, the same volume and time period in the VTM table gives 86%.
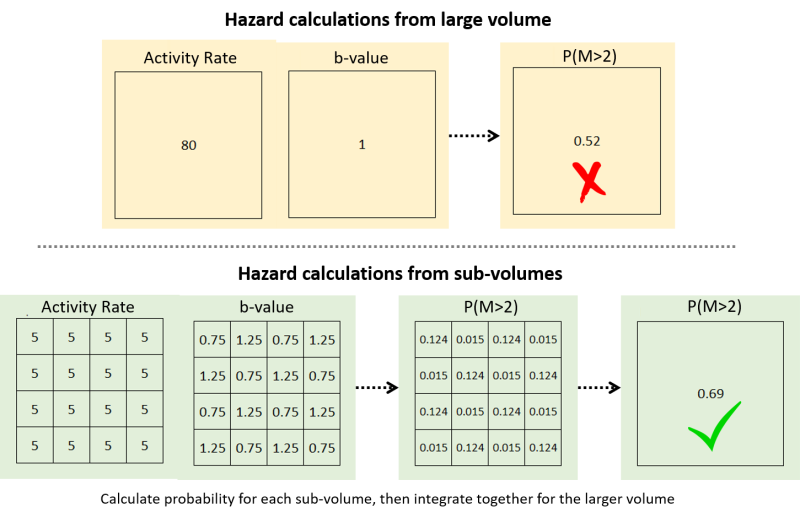
This is because the two calculation methods are quite different. To compute hazard, the main inputs are the seismic activity rate, and the b-value (Mmin and MUL are also required). In the VTM table, a single b-value and activity rate is computed for events within the volume, and the seismic hazard is computed directly. In cases where the b-value does not vary significantly within the volume, this is a reasonable approach. However, in most cases, the b-value varies in space, and this approach tends to underestimate the seismic hazard.
This is illustrated in the figure below. You can represent the full volume with its activity rate and b-value to compute the probabilistic hazard, like in the VTM table. In the Hazard app, the variations in activity rate and b-values are calculated on a regular grid through space (in sub-volumes). While the event search radius for each grid point may exceed the grid cell spacing, the activity rate is normalised and the b-value is assigned to represent the seismicity for the specific grid cell volume. The probability of exceeding the design magnitude within each sub-volume can then be calculated. Then the probabilistic hazard for the full volume can be calculated by integrating together all of the sub-probabilities.
ML Rating – Technical Meaning
As mentioned already, the yearly seismic hazard is expressed as the probability of exceeding the design magnitude. An alternate definition of hazard, is to use a design reliability rather than a design magnitude. I.e. the hazard can be expressed as the magnitude that, to the design reliability, will not be exceeded. We use a reliability of 85%. The ML rating is the design magnitude that would have a probability of exceedance of 15%.
An ML rating is assigned to each grid point to compute the isosurfaces. On the surface of the ML2 iso for example, the ML rating refers to the magnitude that, to a reliability of 85%, would not be exceeded within the standard volume given one year’s seismicity. The standard volume we use is that of a sphere of 50m radius.