

HW–FW filter
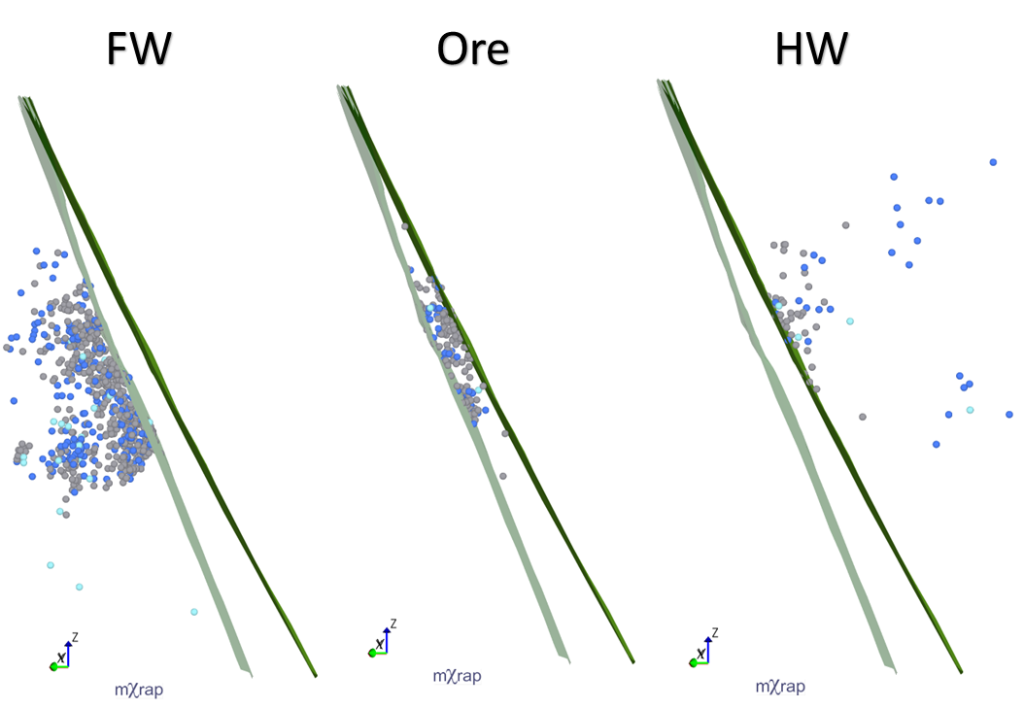
For a few months now, a new tool has appeared in the General Analysis app; the hanging wall (HW) and footwall (FW) filter. The HW–FW filter allows you to filter your events based on where they are in relation to ticked survey/s. If more than one survey or plane is used for the HW–FW filter, […]
Energy – moment relationship
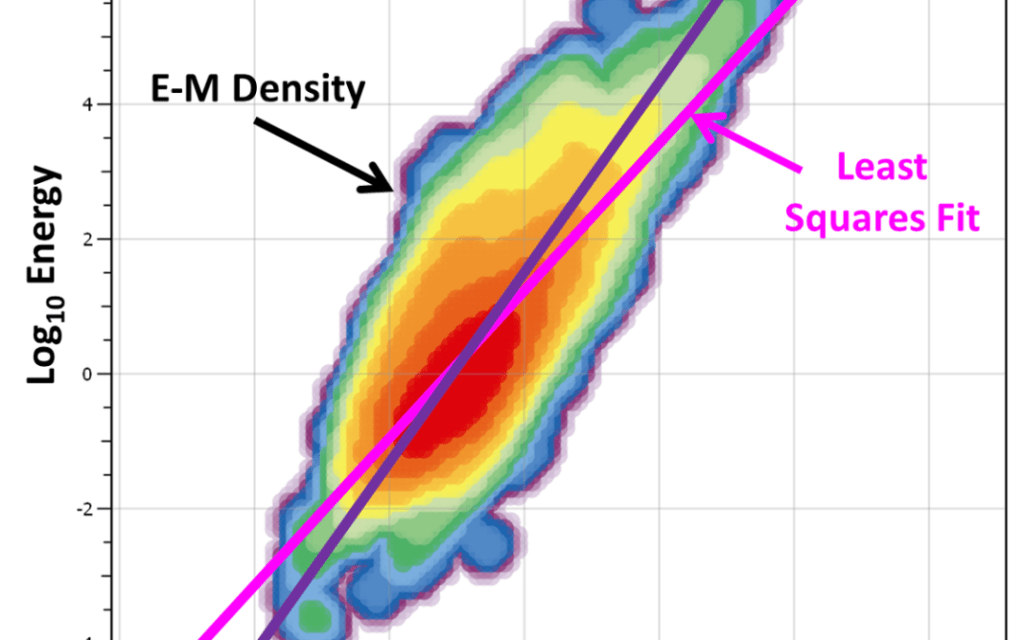
Energy and moment are two independent measures of the strength of a seismic event. Their physical meaning and how they are calculated was described in a previous blog post. Analysis of the relationship between the energy and moment of events can provide insight into seismic sources. For example, blasts or ore pass noise, falsely processed […]
New hazard charts in General Analysis
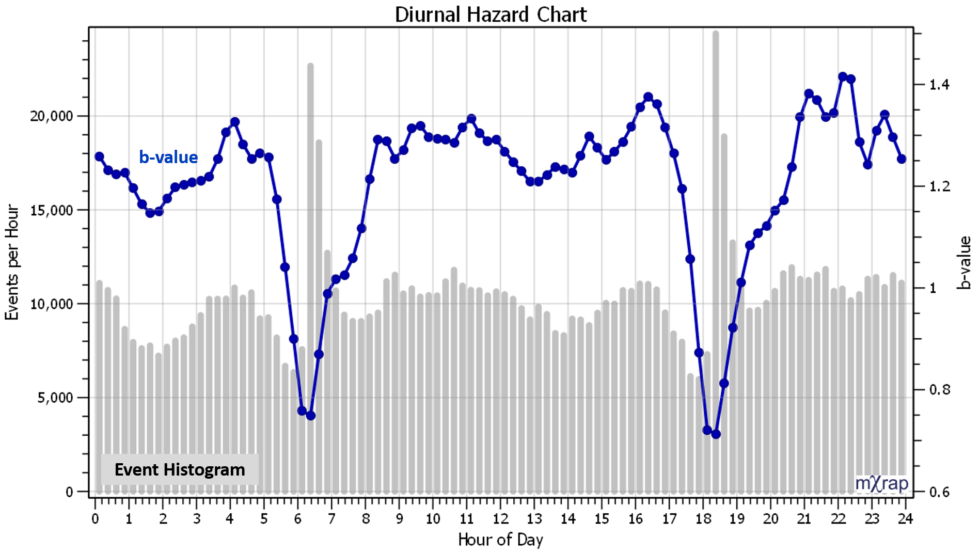
Two new charts have been added to the General Analysis application related to assessing hazard with the frequency-magnitude relationship. The new charts plot various hazard parameters over time, or, by time of day: Charts / Time Series / Hazard over Time Charts / Diurnal / Diurnal Hazard The following parameters can be plotted […]
Stochastic declustering explained
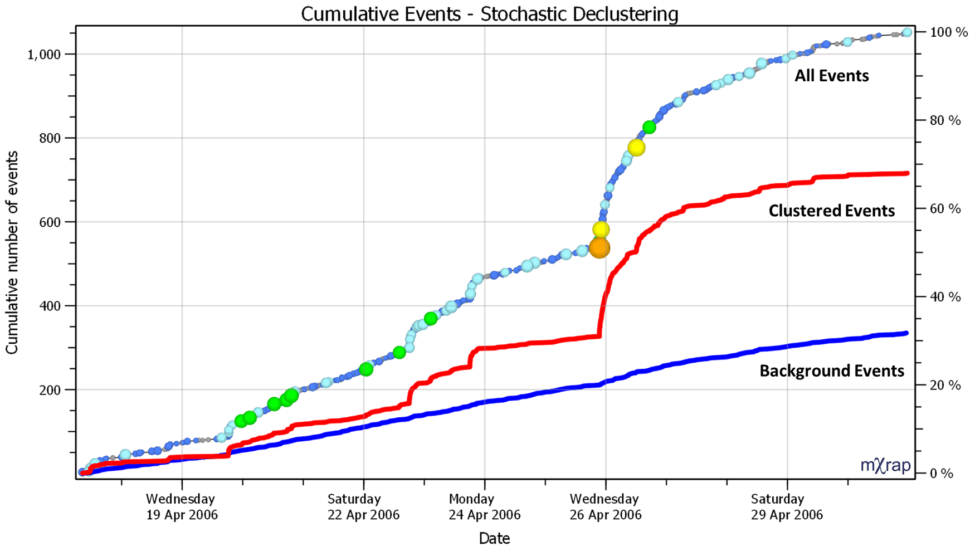
As mentioned in the last blog post, a stochastic declustering algorithm has been implemented in mXrap to separate events into ‘clustered’ and ‘background’ components. It can be useful when designing seismic exclusions and re-entry procedures to separate seismicity that occurs in short bursts from seismicity that has low variability in space and time. Short-term exclusions […]
New background filters
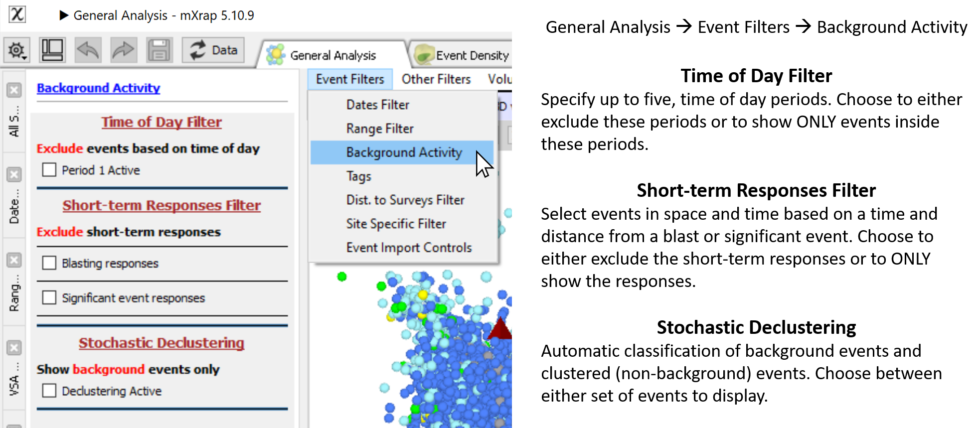
We have added some new event filter options to general analysis related to ‘background’ activity. ‘Background’ events are generally defined as having low variability in space and time. The new background filters aim to identify events that are clustered in space and time and the user can either display the ‘clustered’ or the ‘background’ component […]
Moment tensors – a practical guide
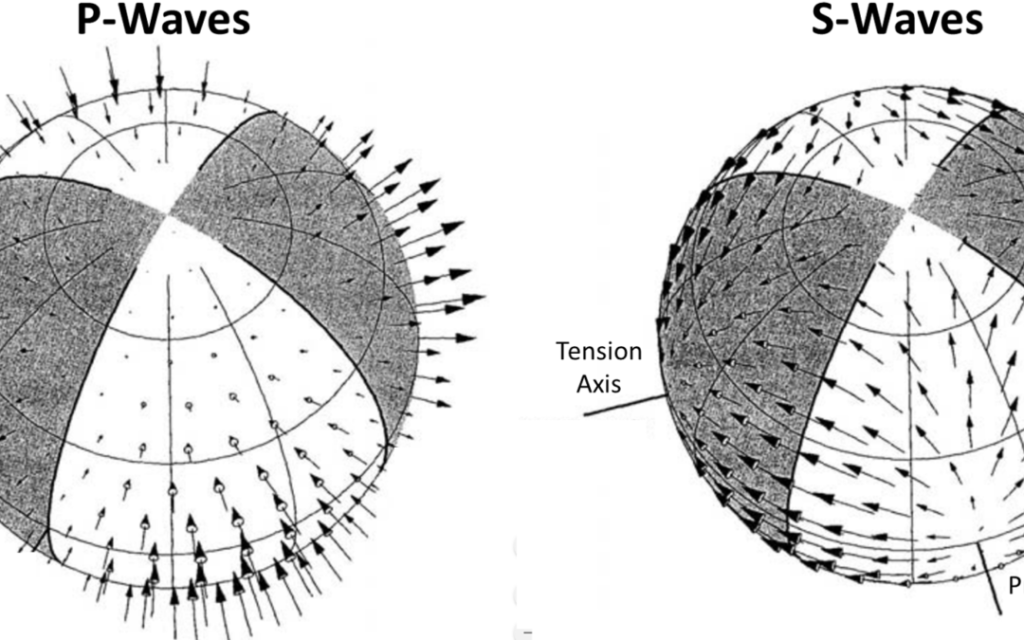
Moment tensor analysis is a topic that carries a decent level of uncertainty and confusion for many people. So I’m going to lay it out as simply as I can. For this post, I’m not going to go into too many details on how moment tensors are actually calculated. But, I’m going to summarise the […]
Moment tensors in General Analysis app
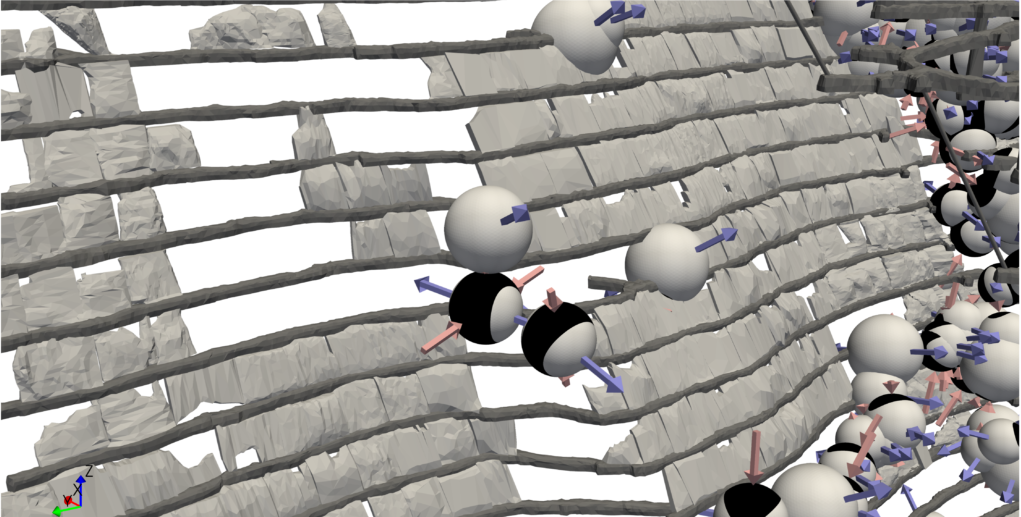
Moment tensors have been added to the General Analysis application in the recent update. Beach balls and principal axes can be viewed in the General Analysis 3D view. There is also a separate Moment Tensor window with a number of stereonets and mechanism charts. Two new training videos have been uploaded to the General Analysis […]
To a/b, or not to a/b

The a/b value is sometimes used as a measure of seismic hazard but there are some common mistakes made with this analysis and interpretation. What is a/b? The Gutenberg-Richter distribution is a statistical model that describes a log-linear relationship between the number of events, N, exceeding magnitude, M. log10 N = a – bM At N […]
Frequency-magnitude chart anatomy

When you are using the frequency-magnitude chart, it can be easy to forget it is log scale and this can distort a few things. Consider the chart below; have you ever thought the Gutenberg-Richter distribution doesn’t look right? Think it isn’t matching the large events very well? The Gutenberg-Richter distribution is a statistical model of […]
Event tags and comments

There are many reasons you might want to store a short snippet of text associated with an event. There are two ways to do this in mXrap; event tags and event comments. Event tags can be used to group events into categories. Example tags might be ‘suspected blast’, ‘damage occurred’, ‘suspect location’, ‘outlier’ or ‘likely […]
