

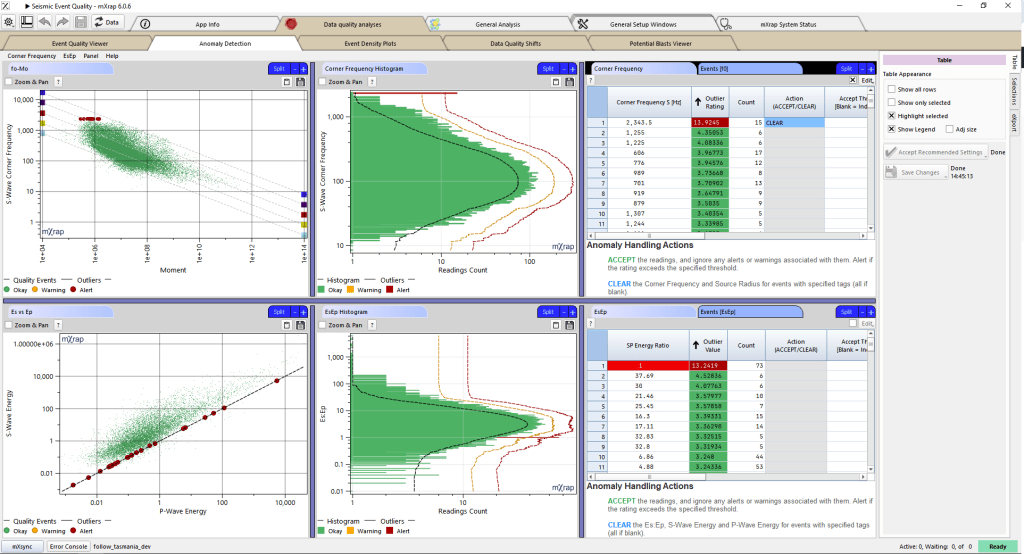
Data Anomaly Detection
Anomalies often stem from default values, null entries, manual input or rounding mistakes. While many of these anomalies indicate bad data, not all do. However, if any data is found to be incorrect, it’s important to clear these values to prevent skewing your analysis. Our new Anomaly Detection window provides visualization tools to help you investigate any flagged anomalies and take appropriate action.
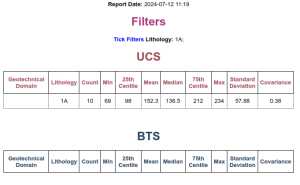
Updates to Rock Mass Data Analyser structure
There have been lots of recent changes to the Rock Mass Data Analyser. Some of these changes just add features, but as part of these changes we have had to re-organise how the data is structured in the app. Please contact support if you have any questions or need any help adjusting your apps/tools.
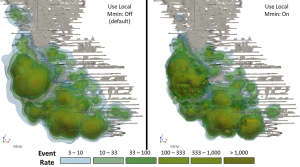
Hazard Assessment – Event Rate
The Hazard Assessment application uses a grid-based approach to describe the seismic hazard throughout your mine. Each grid point essentially represents a seismic source with a specific frequency-magnitude relationship. A frequency-magnitude relationship is defined from the MUL, Mmin, b-value, and event rate. The event rate is something we haven’t taken a dive into yet, so we’ll get into it in this post. Event rate sounds like a simple calculation but there are quite a few

Inspections and data entry app
We are excited to announce our new inspections and data entry app. This app is a general-purpose data entry app designed for offline use with tablet devices which can be customised to fit each site’s exact needs. The app allows simple and fast input of multiple data types (selection, text, numerical inputs, orientation etc.) as well as attaching photos and sketches to reports.

Filter volumes library changes
We have recently updated the JavaScript library mxjs/base/algorithms/filter_volumeset.js to be more efficient. If you are using this library and call the flag_members() method of volume sets directly, then you will need to update your code slightly. If you don’t call flag_members() directly then you’ll automatically get the efficiency updates when you upgrade without needing to do anything, and you can stop reading now 🙂 Previously code would create a finder object from the mxjs/base/algorithms/find_neighbours_3d.js library

Export Panel for 3D Views, Charts and Tables
The export panel, located on the right-hand side of 3D views, charts and tables, can be used to generate images, files, and videos with just a couple of clicks. This panel is particularly useful for preparing presentations and papers that require figures with specific dimensions or font sizes. Use the ‘Export dims:’ functions to create high quality images of a specific size: Use the ‘Content:’ options to change what components are shown: Export tables to
