As mentioned in the last blog post, energy and moment are independently calculated based on the displacement and velocity spectra of the recorded waveforms. Another spectral parameter is the corner frequency.
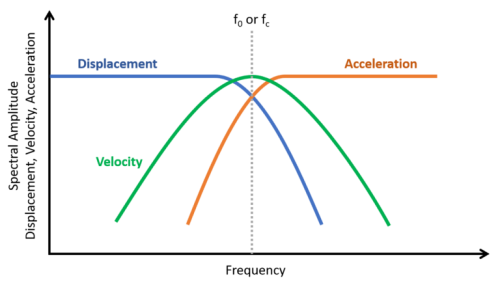
The figure on the left shows the corner frequency (f0) on theoretical displacement, velocity and acceleration spectra. The calculation of corner frequency relies on fitting a reliable source model to the observed spectra.
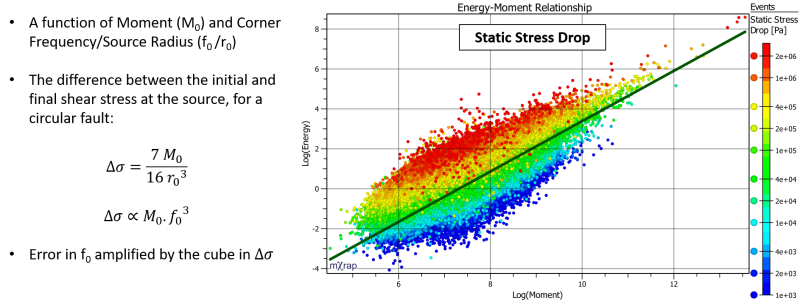
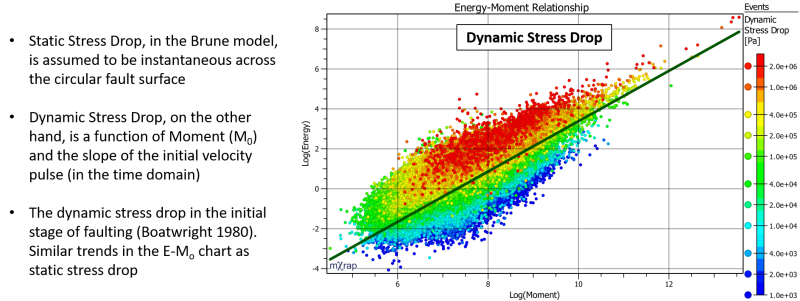
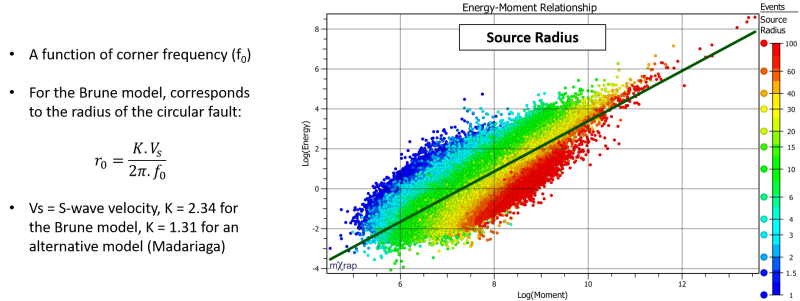
Many commonly used source parameters are derived from Energy, Moment and Corner Frequency. Below is a quick guide to these parameters, illustrated with an Energy-Moment chart that has events coloured by the relevant parameter.
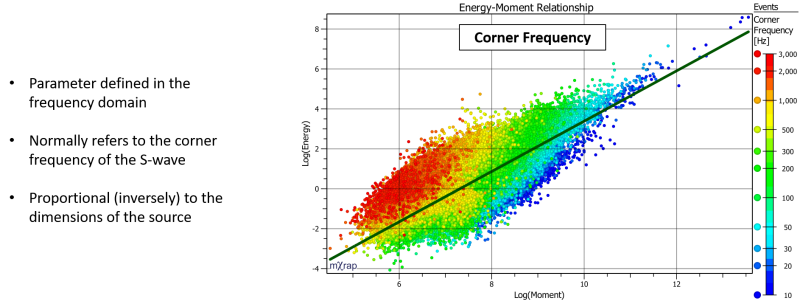
The corner frequency is indicative of the dimensions of the source (source radius in the case of a circular fault). This is a physical relationship easily demonstrated. In the linked video, you can see and hear the decrease in frequency as the length of the ruler is increased. Another example is the change in frequency resulting from changing the length of vibrating guitar strings. For the same physical reasons, larger seismic events tend to have lower frequencies. The radius of the seismic source is calculated from f0.
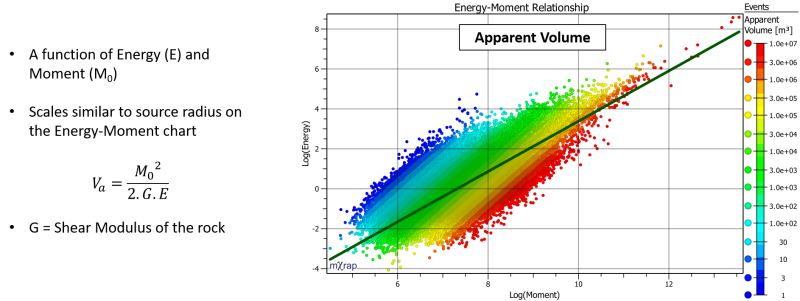
In theory, the source volume can be calculated based on the Moment and source radius. In practice however, “Apparent” volume is more commonly used to approximate the source volume. The source volume is proportional to the cube of source radius, therefore any errors in the source radius parameter (or corner frequency) are amplified. The method of calculating Apparent Volume is more stable, based on Energy and Moment.