The Rock Mass Data Analyser (RMDA) application allows a user the ability to input various types of geotechnical data into mXrap, creating a geotechnical database of borehole and mapping data, which may be easily visualised and analysed in 3D, on charts and in stereonets.
Thus far, the application has been developed to allow for the visualisation and assessment of:
- Rock mass quality data e.g. RQD, RMR, Q, Q’, GSI etc.
- Structural data i.e. joint orientations and joint conditions from scanline mapping and logging data
- Laboratory test results e.g. UCS, TCS, and BTS
Once data has been imported there are multiple filter options available for borehole IDs, lithologies, data sources, joint sets and rock strength test types. Pre-set legends for all geotechnical data is also provided within the app as well as the ability to select and filter data based on 3D locations.
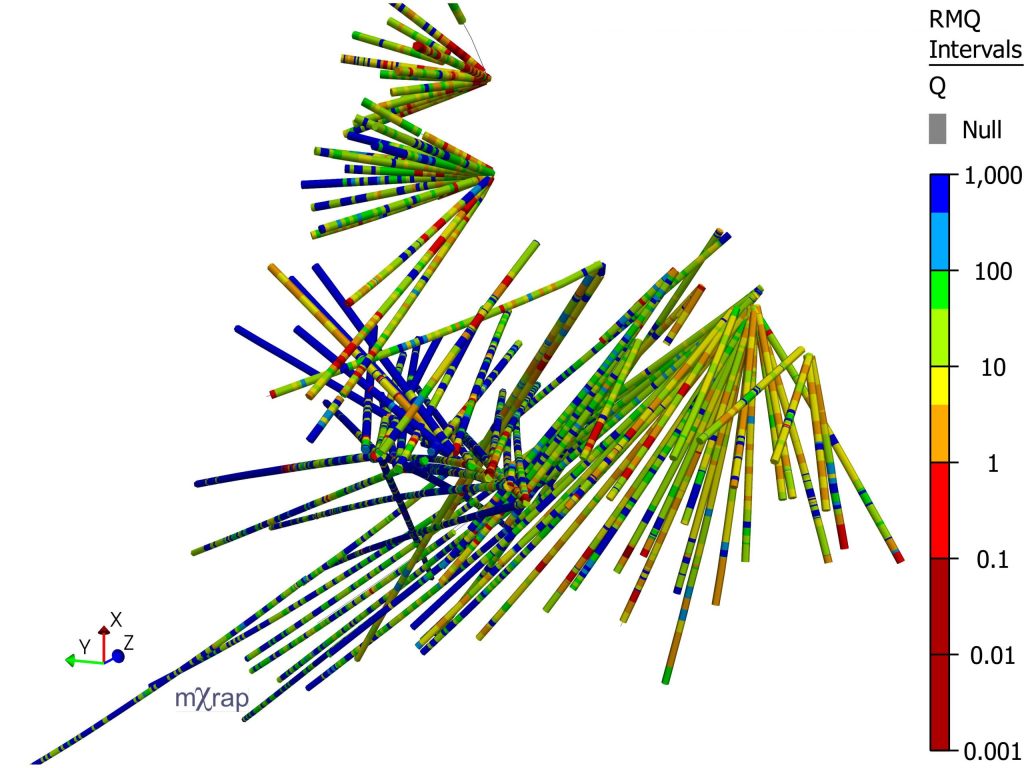
Q values plotted along boreholes
Histograms and CDF curves of rock mass quality data are also available for the various lithologies and boreholes in the database. These lithologies may be combined or plotted separately. The ability to select data based on 3D location also provides the user the opportunity to create histograms for a specific geotechnical domain or area of interest.
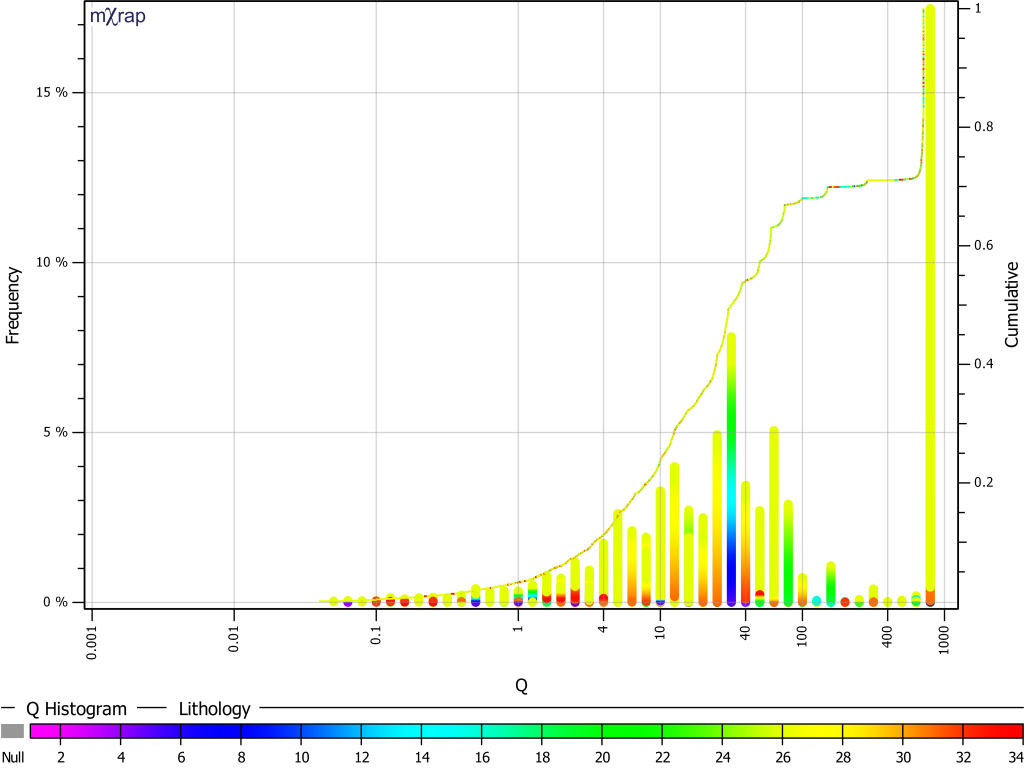
Histogram and CDF curve of Q values for a combination of lithologies
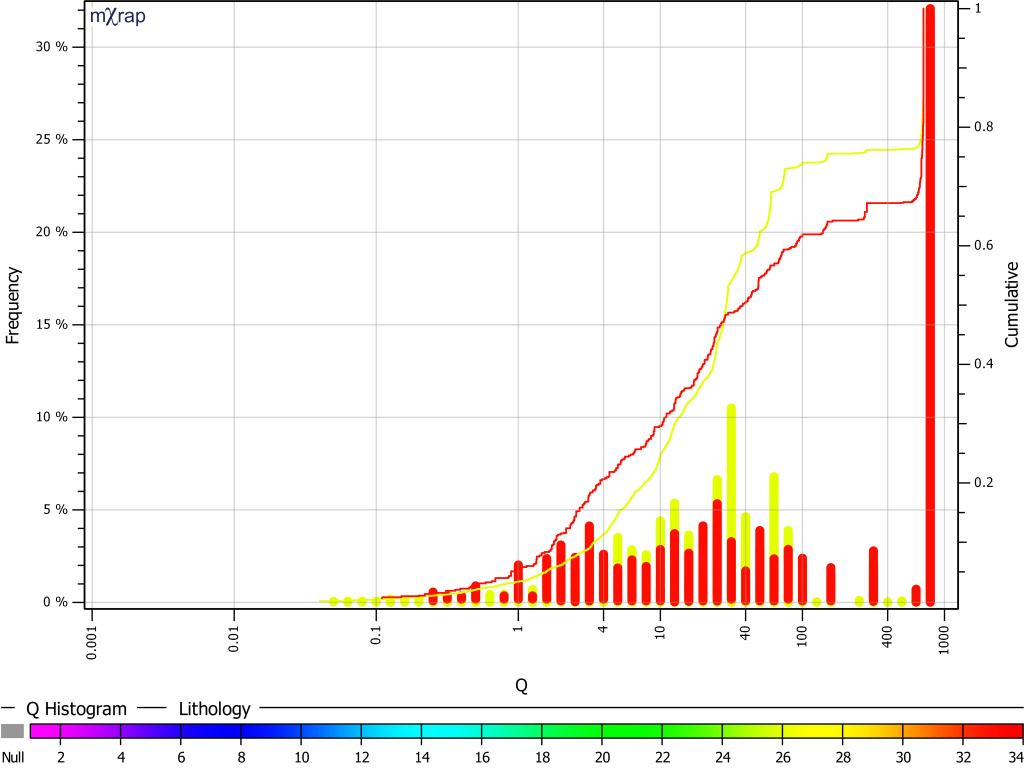
Histogram and CDF curves of Q values for two lithologies plotted separately
Both scanline mapping data and borehole structural logs can be imported and viewed in 3D and on stereonets. Once structural data is imported, the user has the option to assign discontinuity sets on stereonets. As sets are assigned or as filters are applied, real time updates to discontinuity set statistics are also provided.
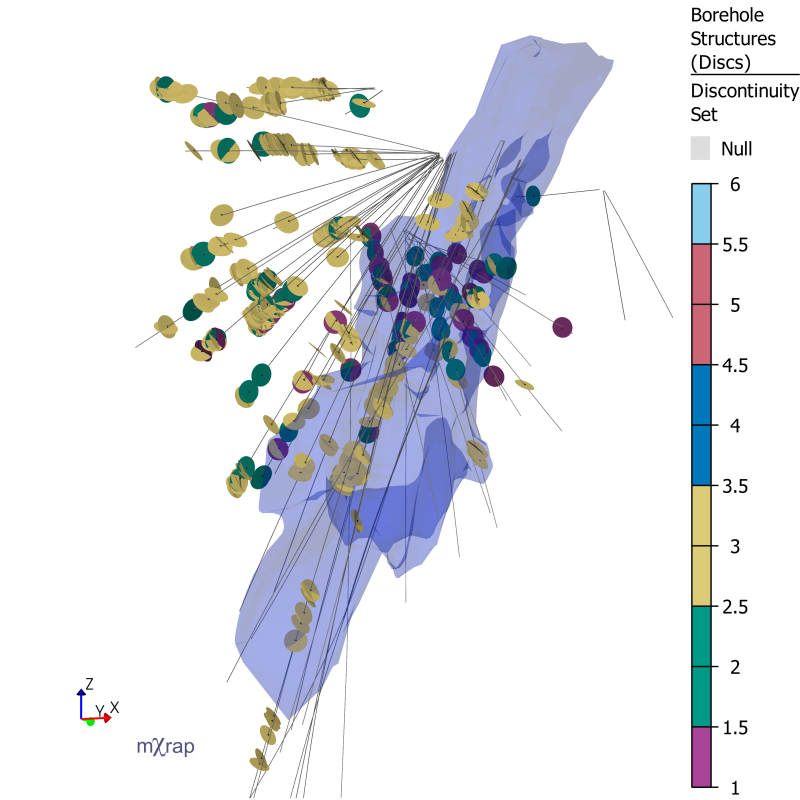
Structures plotted along boreholes based on discontinuity set
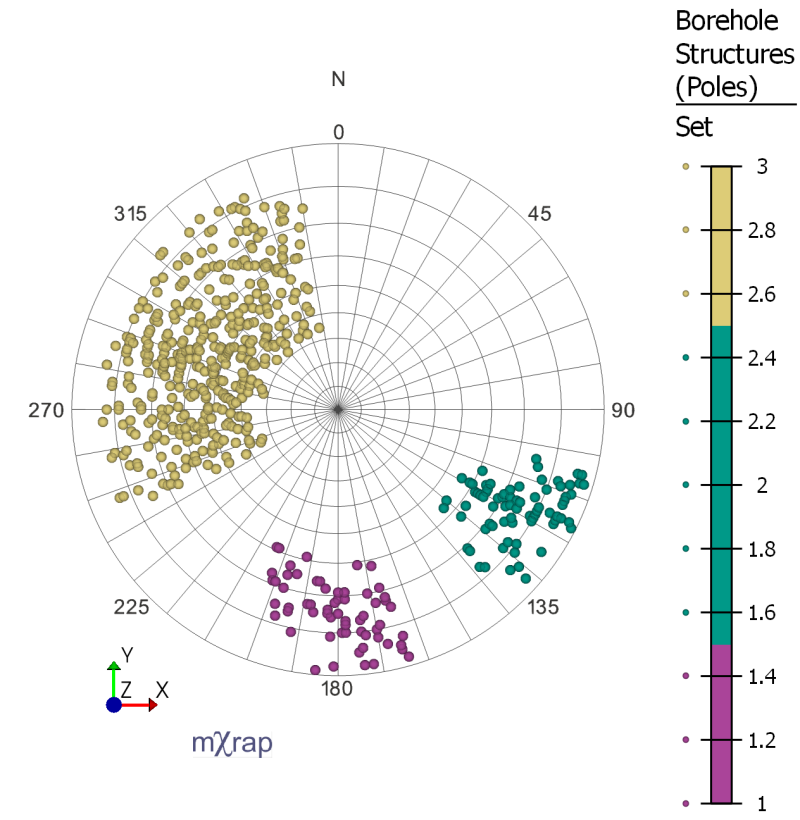
Poles plotted on stereonet based on discontinuity set
For intact strength laboratory test results, along with visualisation of the test result locations along boreholes, Hoek-Brown failure envelopes can also be produced for specific lithologies, a group of data or for specific boreholes.
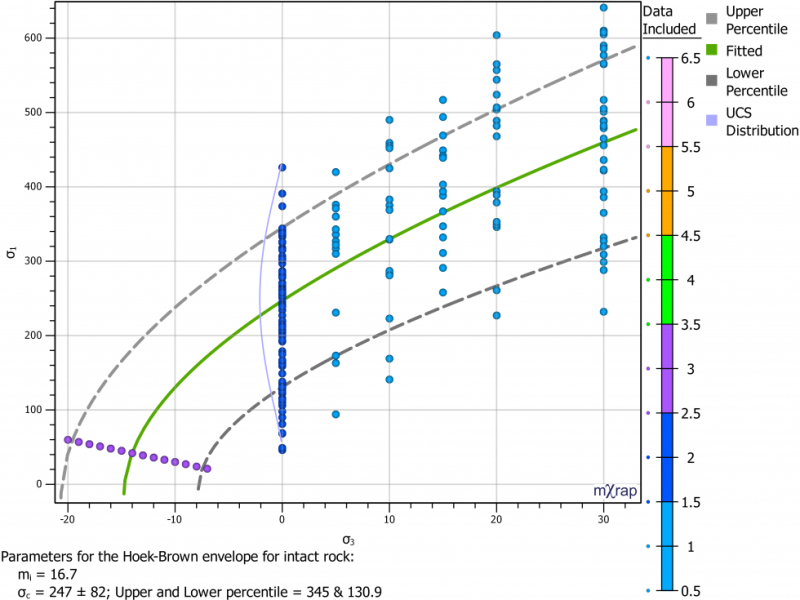
Hoek-Brown curves based on UCS, TCS and BTS test results
The RMDA is also integrated with mXrap’s Discrete Fracture Network (DFN) generation app and our data collection web app (which allows for efficient scanline mapping with the use of a tablet). Currents plans for the RMDA include the development of a window mapping section and integration with mXrap’s seismic suite, allowing a user to view their rock mass quality and structural data along with their seismic events. The RMDA will also act a feeder app into the stope reconciliation and geotechnical block model applications, which are currently under development.
For more information or if you would like to try the RMDA application, please contact our support email.