We have developed a new app to aid in the design of paste backfill in stoping operations. The app has tools to help you to:
- Calculate paste fill volumes and bund capacities,
- Assess the fill stresses and stability for vertical and horizontal exposures,
- Analyse UCS test results and fit a strength prediction model, and,
- Assess the pressure and friction profile of the paste reticulation path.
If you would like to try out the app, please contact our info email.
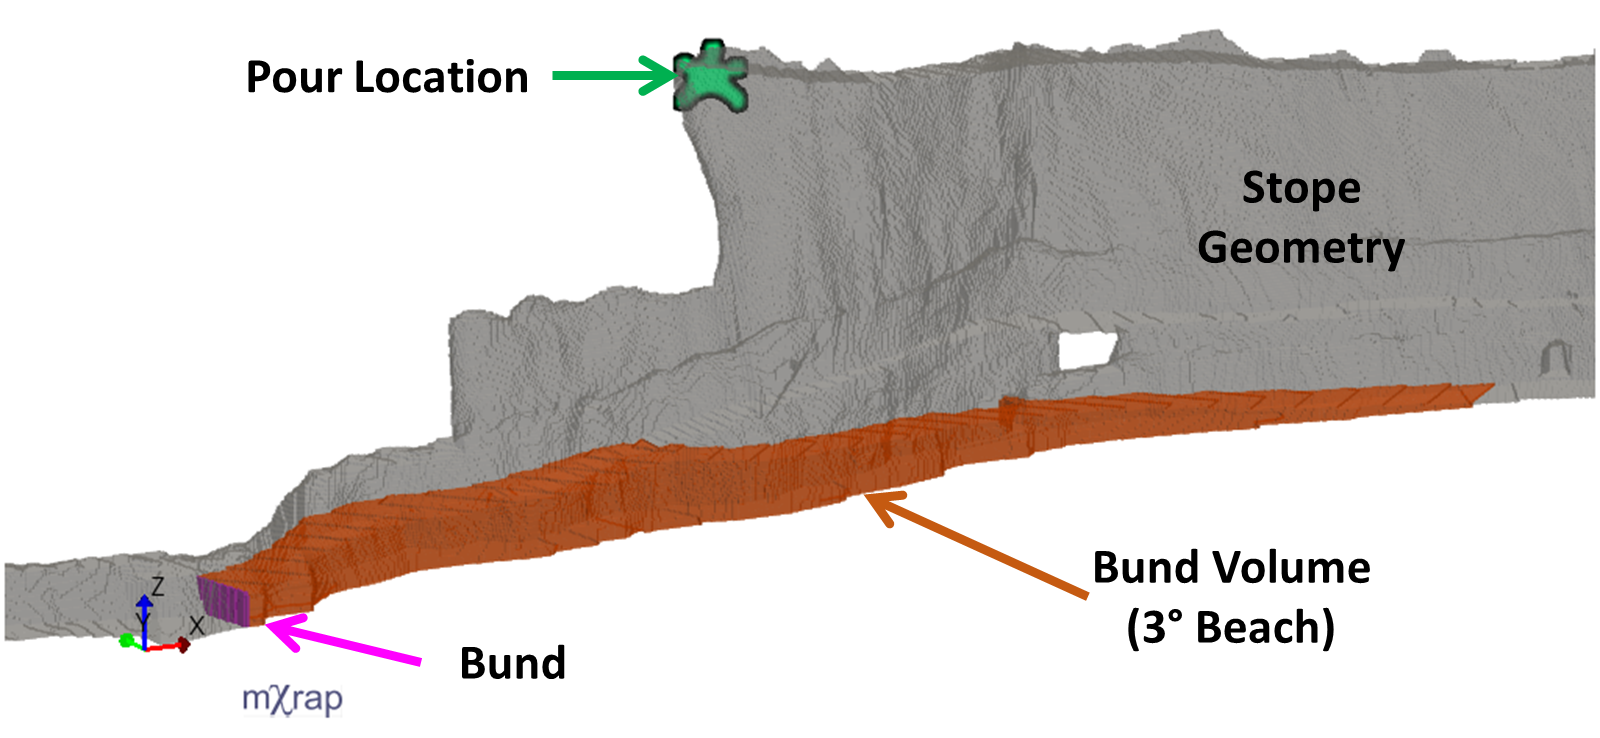
Paste volumes
The paste volume calculations use the mine geometry app to input surveyed geometry. Walls/barricades and bunds can be added to the geometry. Paste is deposited into the geometry from a specified pouring location. The path of the paste flow is simulated according to the beach angle. The beach angle informs the maximum horizontal spread of the paste. The effect of overburden pressure (pushing paste uphill) or additional flow effects are not considered. The video below shows an example of a paste filling scenario. In this case the beach angle is 3°.
Bund capacities can be calculated by turning off the relevant wall and finding the volume at which the bund has overflowed.
Stability Analysis
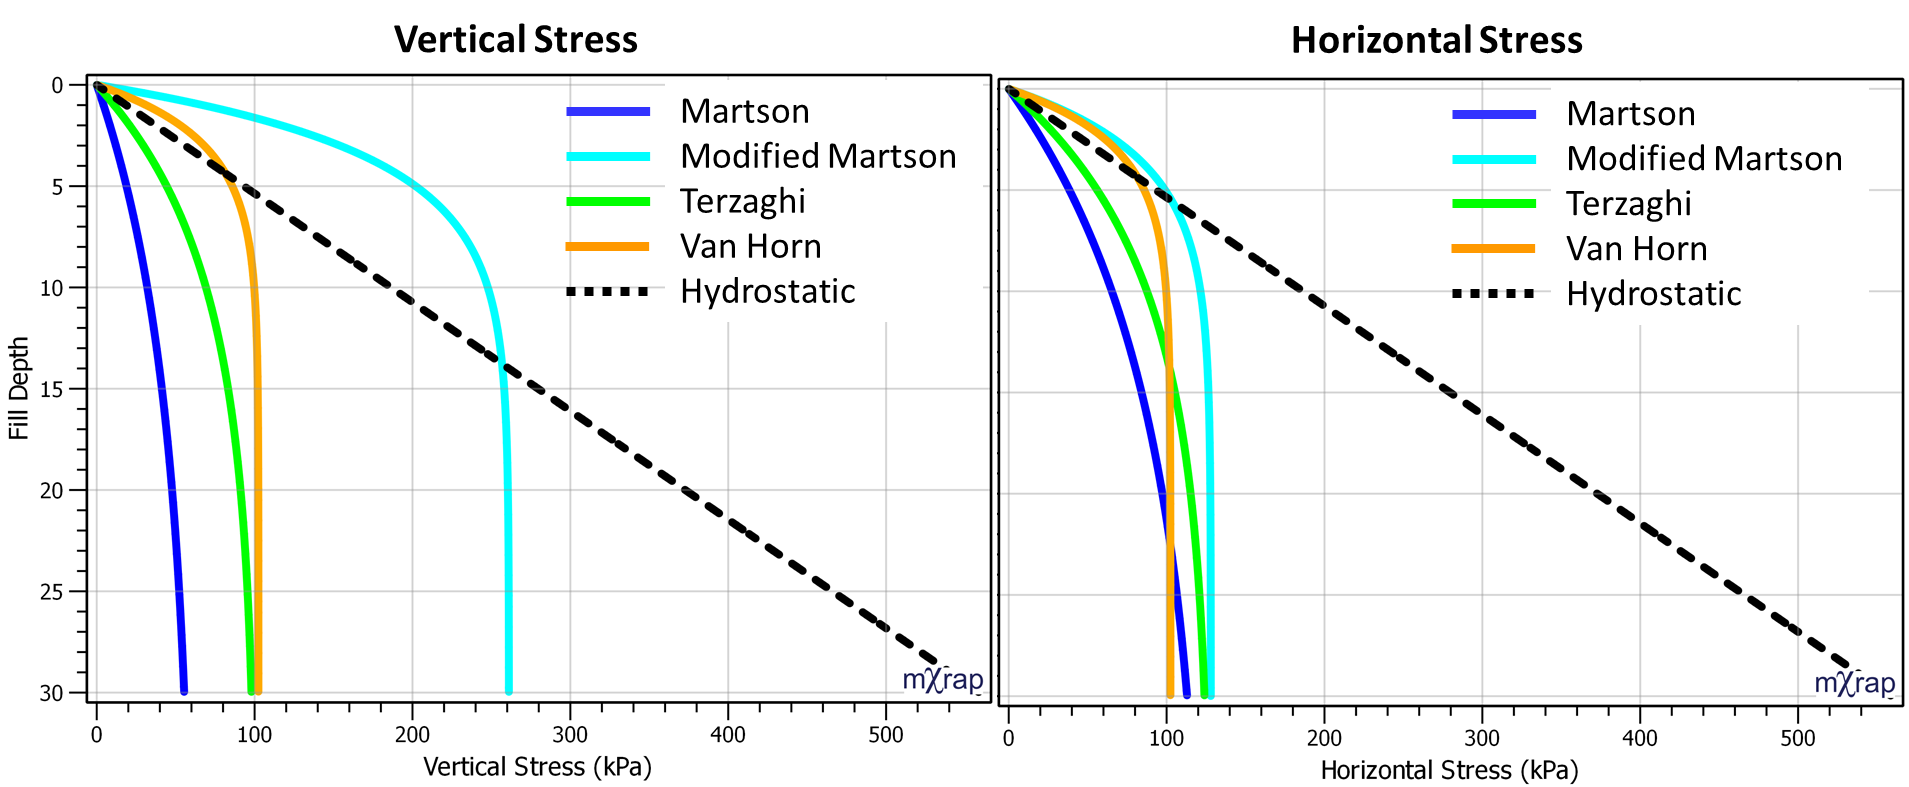
Several analytical methods from various sources have been implemented in the app to estimate the stresses within the fill mass and the required UCS for vertical and horizontal exposures. The methods to compute stresses are listed below. The stresses at the base of the stope are reported in a table and charts show the variation in stress by fill depth.
| Method | Reference | Description |
| Martson’s cohesionless model | Martson 1930 | 2D arching, no cohesion, active earth pressure |
| Modified Martson’s cohesionless model | Aubertin et al. 2003 | Martson method with passive or at-rest earth pressure |
| Terzaghi’s cohesive material model | Terzaghi 1943 | 2D arching, with cohesion |
| Van Horn’s 3D model | Van Horn 1964 | 3D analytical arching solution |
| Hydrostatic stress | – | Stress from overburden weight (K=1) |
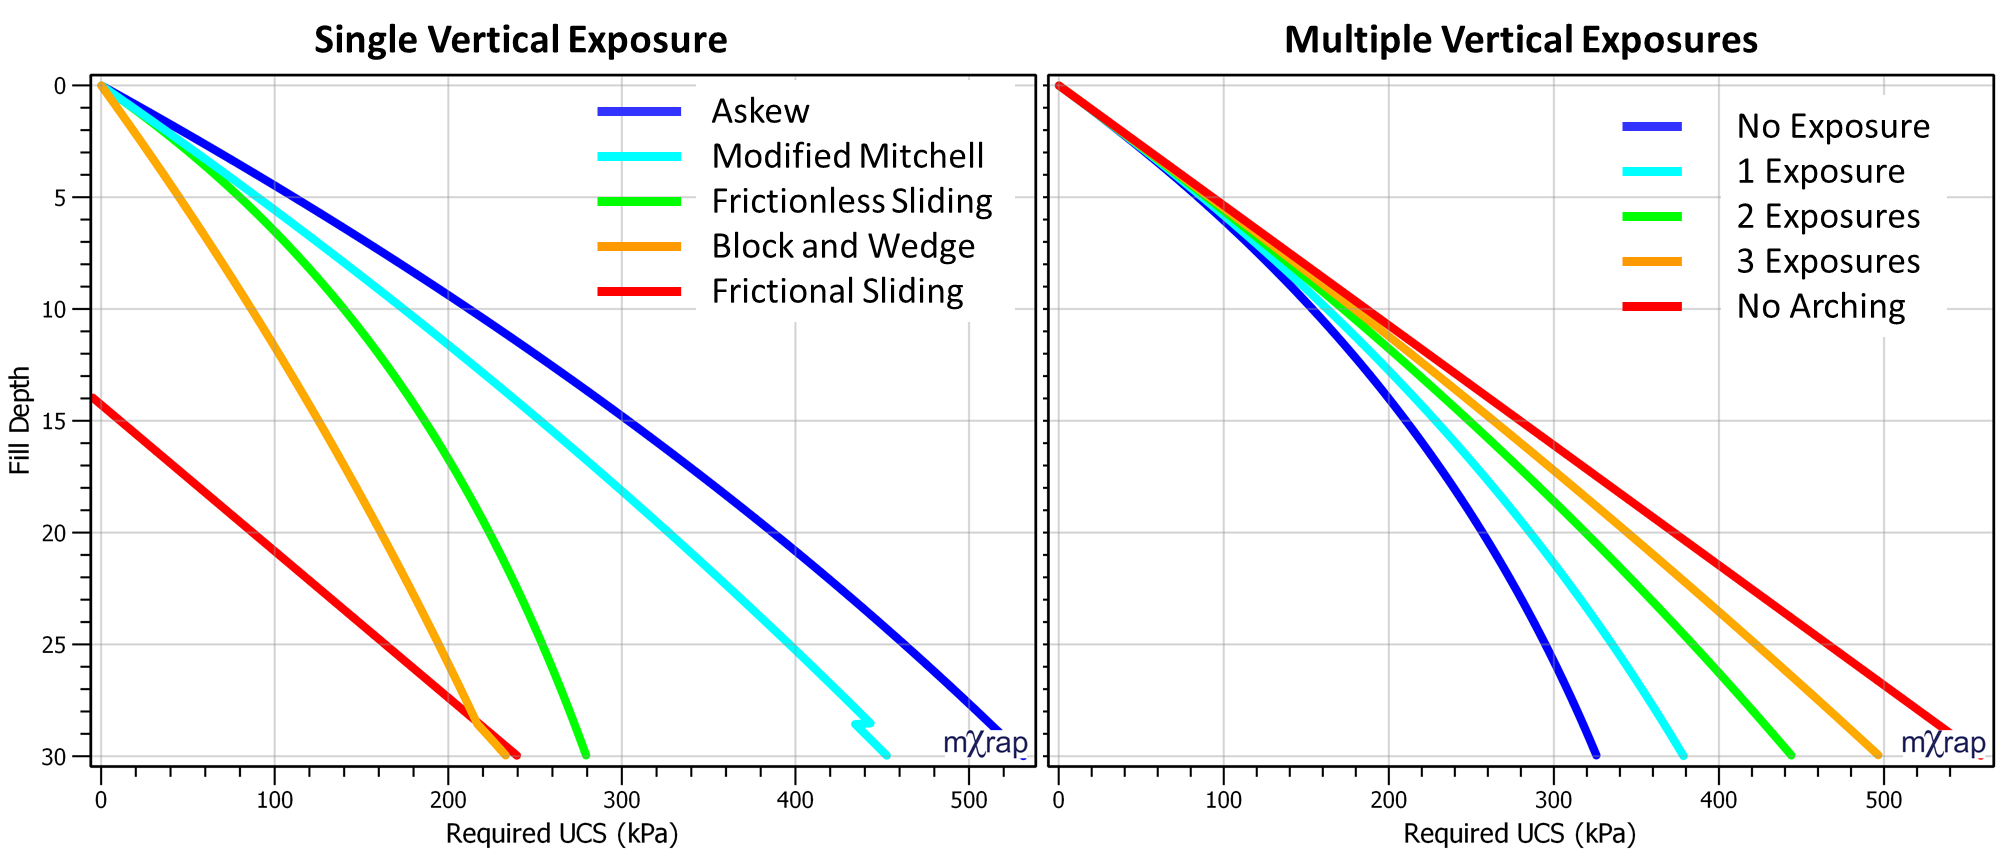
The methods to compute the required UCS for vertical exposures are listed below. Most methods only apply to a single vertical exposure. One approach looks at multiple vertical exposures where the arching effect is related to how much of the stope perimeter has not yet been exposed. The order of wall exposure can be adjusted by editing the exposure priority.
| Method | Reference | Description |
| Askew narrow face method | Askew et al. 1978 | 2D finite element based, includes Terzaghi arching |
| Frictional sliding block | Mitchell et al. 1982 | Sliding Block LE, cohesion resistance on side walls equal to fill cohesion, failure plane 45° + φ/2, height >> width |
| Frictionless sliding block | Mitchell 1983 | Sliding Block LE, without side wall resistance, cohesion = UCS/2 (Tresca), failure plane 45° + φ/2, height >> width |
| Modified Mitchell | Li and Aubertin 2012 | Includes surcharge, includes friction on sliding plane, cohesion between fill and rock a fraction of fill cohesion, high and low aspect ratio stopes treated differently |
| Block and wedge | Li 2013 | Generalised solution includes friction on each wall, limit equilibrium approach for a wedge and overlying rectangular block |
| Multiple exposures | Bloss (1992)
Winch (1999) | General arching solution, arching effect reduced based on the proportion of stope perimeter exposed. |
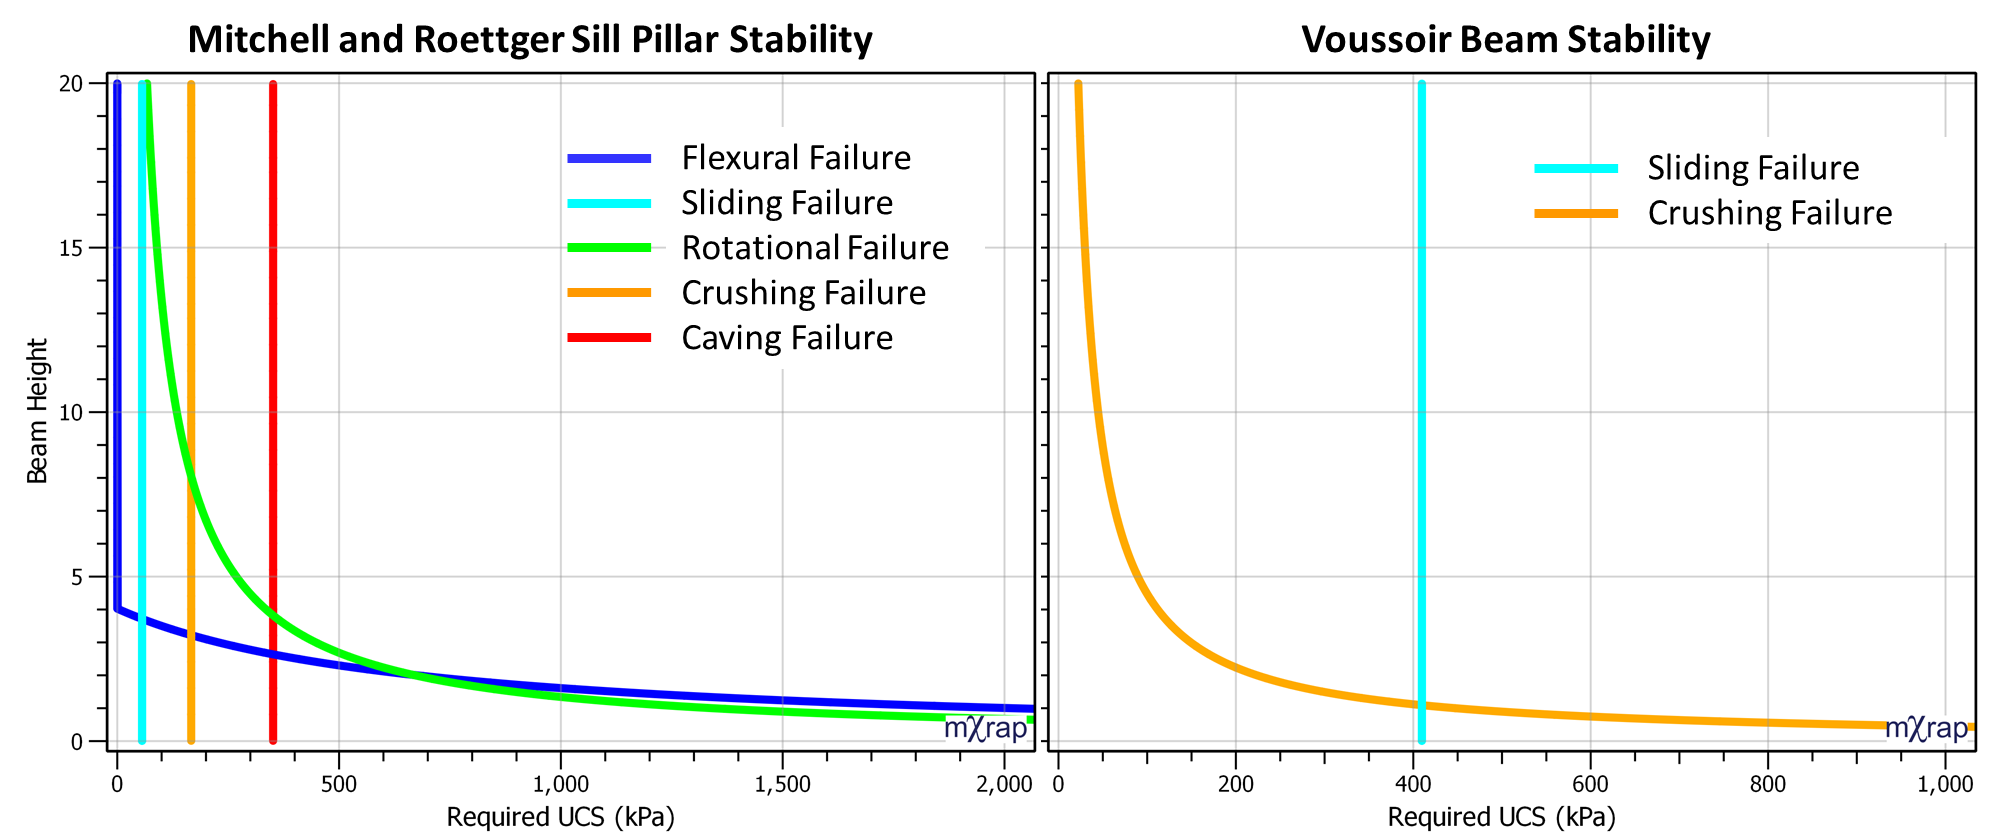
The required UCS for horizontal exposure is computed for a 2D beam. The 2D beam might be considered the first “plug” run. There is optional beam loading to represent additional fill mass above the beam. The beam loading can be estimated from the vertical stress. The 2D beam analysis is based on Mitchell & Roettger (1989) that considers a number of failure modes of a sill pillar:
- Crushing failure (from convergence of the stope)
- Rotational failure
- Flexural failure (bending)
- Caving failure
- Sliding failure (abutment shear)
Horizontal exposure is also assessed using voussoir beam analysis based on the original work of Evans (1941) and later Beer & Meek (1982) that considers the strength of a compressive arch within a rectangular beam. The analysis looks at crushing and sliding failure. The procedure was also described in Diederichs & Kaiser (1998).
Paste Testing
A database of UCS test results can be used to fit a strength prediction model. The model can be used to predict the UCS based on the binder and tailings type, binder %, and age. The curing model is based on the following equation:
UCS = (A.Binder+B).log10(Age) + C.Binder + D + Epsilon
- UCS is the strength in kPa
- Binder is in %
- Age is the curing time in days
- Epsilon is the error function which is based on a normal distribution with mean of zero and standard deviation = E.log10(Age) + F
- A, B, C, D, E and F are all model coefficients, solved for each binder and tailings type
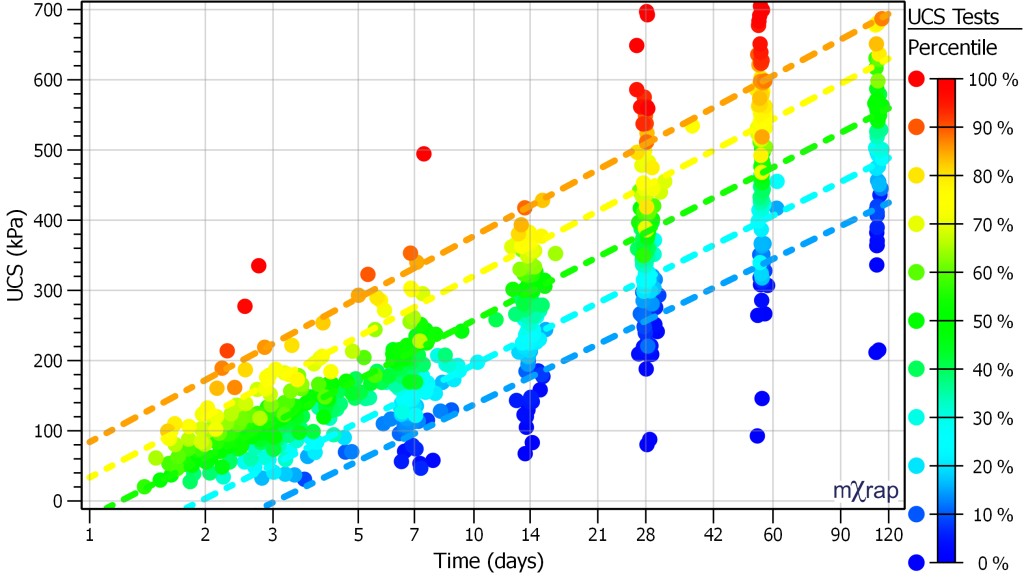
A number of charts can be used to interrogate the UCS results and curing model. The chart below shows the UCS percentiles for 5% cement paste (UCS tests shown between 4.5% and 5.5%). Percentile lines are plotted for 10%. 25%. 50%, 75%, and 90%.
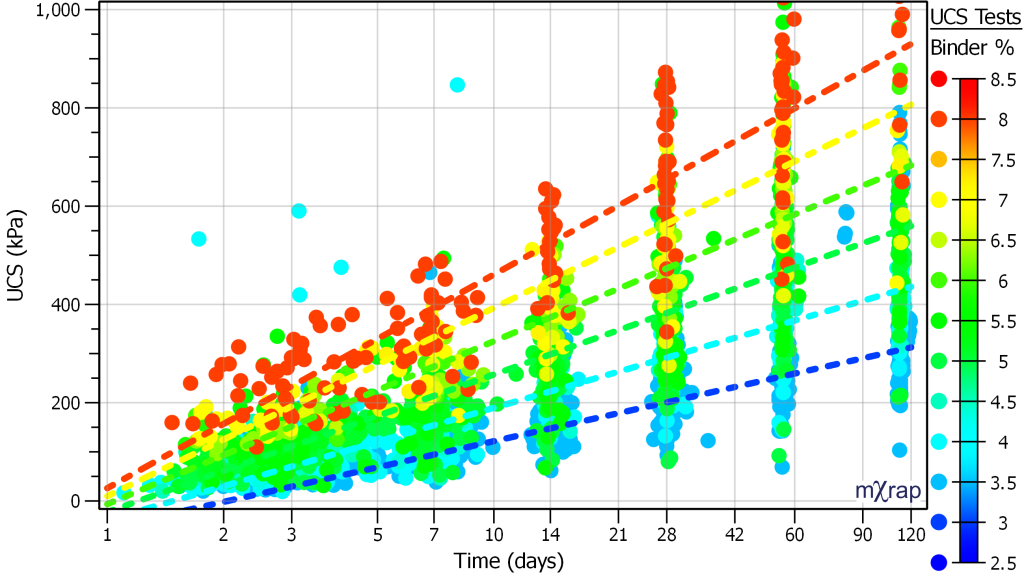
The chart below shows the curing profile of different cement content percentages. The 50th percentile line is plotted for cement contents of 3%, 4%, 5%, 6%, 7%, and 8%.
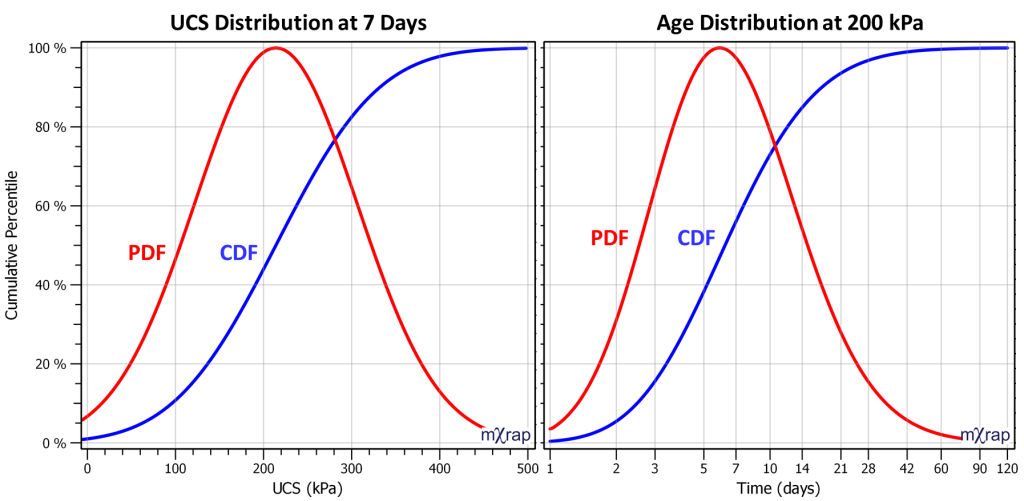
There are also charts to show the UCS distribution for a particular test age or the age distribution to reach a particular UCS. The distributions below are for 5% cement paste. The UCS distribution after 7 days curing is on the left and the age distribution for 200 kPa UCS is on the right.
Reticulation
The pressure profile along the paste reticulation path can be analysed to ensure the paste gravitational flow will overcome the pipe friction and reach the stope. The annotations tool can be used to draw a polyline along the paste delivery path. Any saved annotation can be used as the retic path. Once the diameter has been set for each pipe segment, the friction loss is calculated based on the work of Goldsack (1998). There is also an option to use a constant friction loss for all pipe segments.
The Goldsack (1998) friction loss is based on the following equation:
ΔP/L = 16τ0/3D + 32ηV/D²
- ΔP/L = Pressure loss per metre
- τ0 = Yield Stress
- D = Pipe inner diameter
- η = Bingham viscosity
- V = Linear flow velocity
The first term (with yield stress) tends to dominate the second term (with viscosity). This is why many people ignore the second term and base the friction loss on yield stress and diameter alone. You have the choice to include the viscosity term or not.
The yield stress can be determined from a shear vane test or a slump test. There is a tool to calculate yield stress from the maximum torque of a shear vane test, based on Dzuy & Boger (1983). There are also tools to calculate yield stress from a modified slump test (cylindrical test), based on Pashias et al. (1996) or the generalised slump test (cone), from Saak et al. (2004).
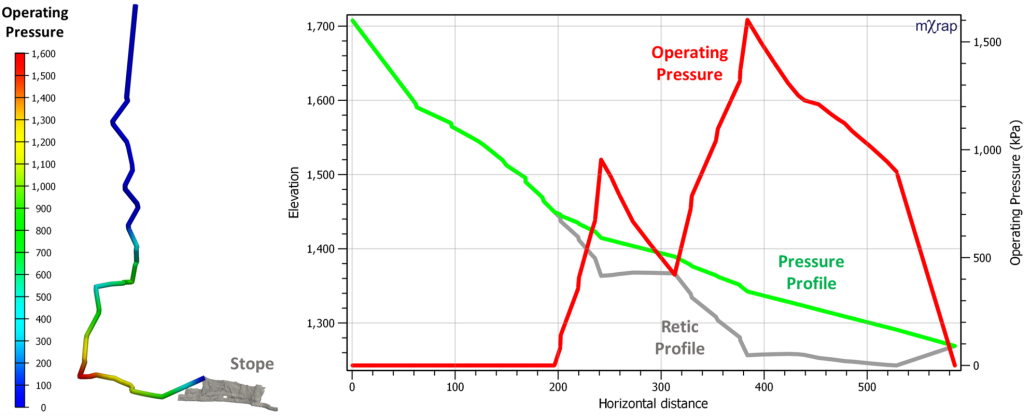
The image below shows an example of the paste reticulation calculations. The operating pressure along the path is plotted in 3D. The chart shows the retic path geometry and the pressure profile. Where the pressure matches the retic profile, the paste is in free-fall and the operating pressure is zero. When the pressure profile is above the retic profile, the paste must back-up the line to build enough pressure to maintain flow. The pipe operating pressure is the difference between the pressure and retic profiles.
References
Askew, J, McCarthy, PL & Fitzgerald, DJ 1978, ‘Backfill research for pillar extraction at ZC/NBHC’, Mining with Backfill, vol. 12, pp.100-110.
Aubertin, M, Li, LSTBM, Arnoldi, S, Belem, T, Bussière, B, Benzaazoua, M & Simon, R 2003, ‘Interaction between backfill and rock mass in narrow stopes’, Soil and Rock America, vol. 1, no. 2, pp.1157-1164.
Beer, G & Meck, JL 1982, ‘Design curves for roofs and hanging-walls in bedded rock based on’voussoir’beam and plate solutions’, Transactions of the Institution of Mining and Metallurgy, Sect. A, vol. 91.
Bloss, ML 1992, Prediction of cemented rock fill stability: design procedures and modelling techniques, The University of Queensland, St Lucia.
Diederichs, MS & Kaiser, PK 1999, ‘Stability of large excavations in laminated hard rock masses: the voussoir analogue revisited’, International Journal of Rock Mechanics and Mining Sciences, vol. 36, no. 1, pp.97-117.
Dzuy, NQ & Boger, DV 1983, ‘Yield stress measurement for concentrated suspensions’, Journal of Rheology, vol. 27, no. 4, pp.321-349.
Evans, W 1941, ‘The strength of undermined strata’, Transactions of the Institution of Mining and Metallurgy, vol. 50, pp.475-500.
Goldsack, DE 1998, Elements of Pastefill Rheology, Centre in Mining and Mineral Exploration Research, Laurentian University, Sudbury.
Li, L & Aubertin, M 2012, ‘A modified solution to assess the required strength of exposed backfill in mine stopes’, Canadian Geotechnical Journal, vol. 49, no. 8, pp.994-1002.
Li, L 2014, ‘Generalized solution for mining backfill design’, International Journal of Geomechanics, vol. 14, no. 3, p.04014006.
Marston, A 1930, ‘The theory of external loads on closed conduits in the light of the latest experiments’, Highway Research Board Proceedings, vol. 9.
Mitchell, RJ, Olsen, RS & Smith, JD 1982, ‘Model studies on cemented tailings used in mine backfill’, Canadian Geotechnical Journal, vol. 19, no. 1, pp.14-28.
Mitchell, RJ 1983, ‘Earth mechanics in earth structures engineering’, Earth Structures Engineering, pp. 38-86.
Mitchell, RJ & Roettger, JJ 1989, ‘Analysis and modelling of sill pillars’, Innovations in Mining Backfill Technology, pp.53-61.
Pashias, N, Boger, DV, Summers, J &Glenister, DJ 1996, ‘A fifty cent rheometer for yield stress measurement’, Journal of Rheology, vol. 40, no. 6, pp.1179-1189.
Saak, AW, Jennings, HM & Shah, SP 2004, ‘A generalized approach for the determination of yield stress by slump and slump flow’, Cement and Concrete Research, vol. 34, no. 3, pp.363-371.
Terzaghi, K 1943, Theoretical Soil Mechanics, John Wiley & Sons. New York, pp.11-15.
Van Horn, DA 1964, ‘A study of loads on underground structures’, Proceedings of the Symposium on Soil-Structure Interaction.
Winch, C 1999, Geotechnical characteristics and stability of paste backfill at BHP Cannington mine, BE Hons Thesis, James Cook University, Townsville.