

Data Anomaly Detection
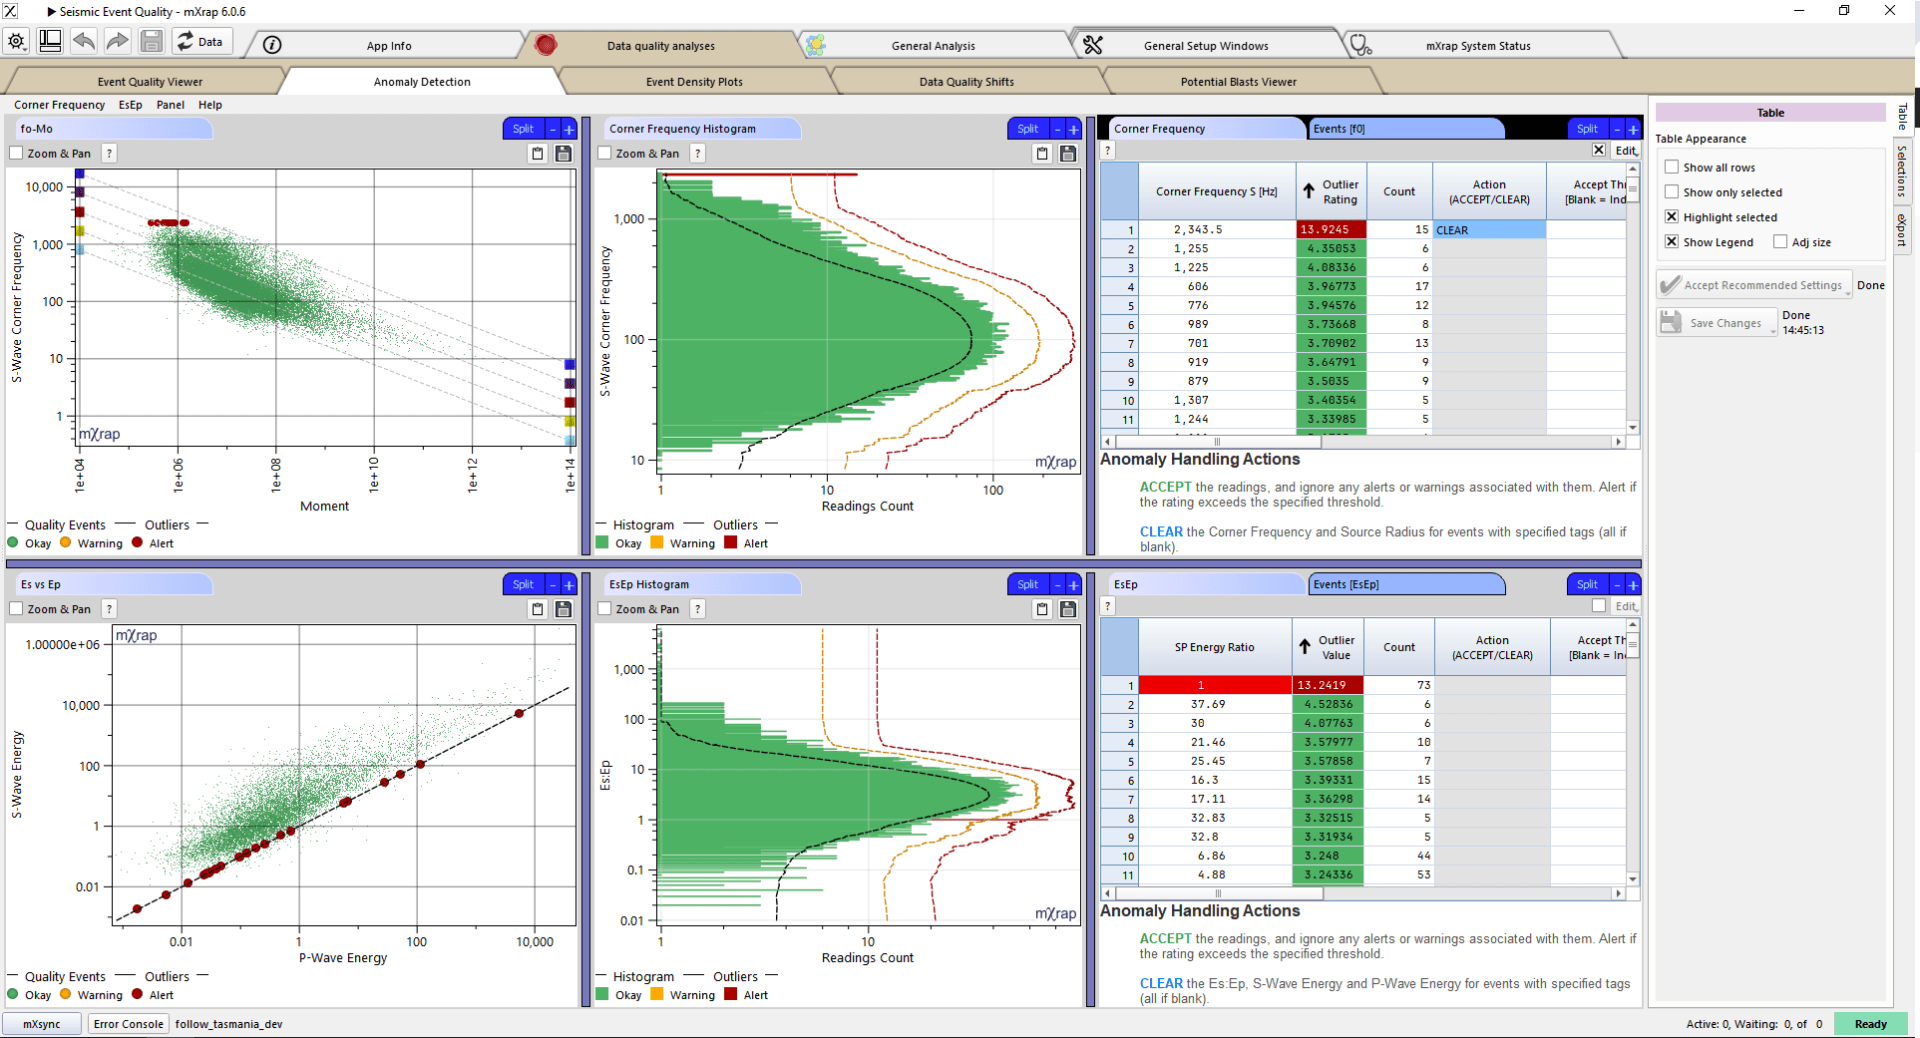
Anomalies often stem from default values, null entries, manual input or rounding mistakes. While many of these anomalies indicate bad data, not all do. However, if any data is found to be incorrect, it’s important to clear these values to prevent skewing your analysis. Our new Anomaly Detection window provides visualization tools to help you investigate any flagged anomalies and take appropriate action.
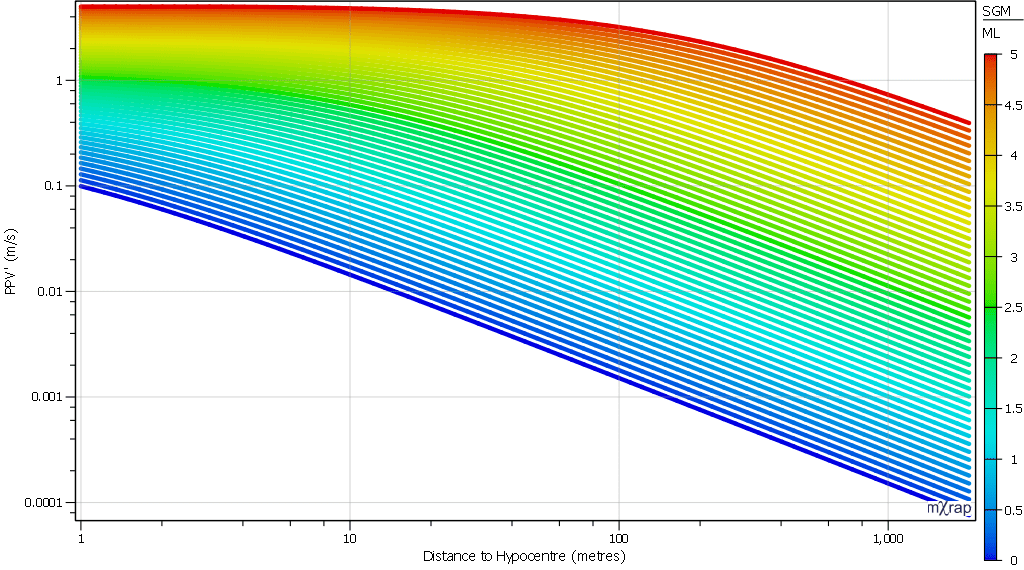
Hazard Assessment – Event Rate

The Hazard Assessment application uses a grid-based approach to describe the seismic hazard throughout your mine. Each grid point essentially represents a seismic source with a specific frequency-magnitude relationship. A frequency-magnitude relationship is defined from the MUL, Mmin, b-value, and event rate. The event rate is something we haven’t taken a dive into yet, so we’ll get into it in this post. Event rate sounds like a simple calculation but there are quite a few complexities worth explaining.
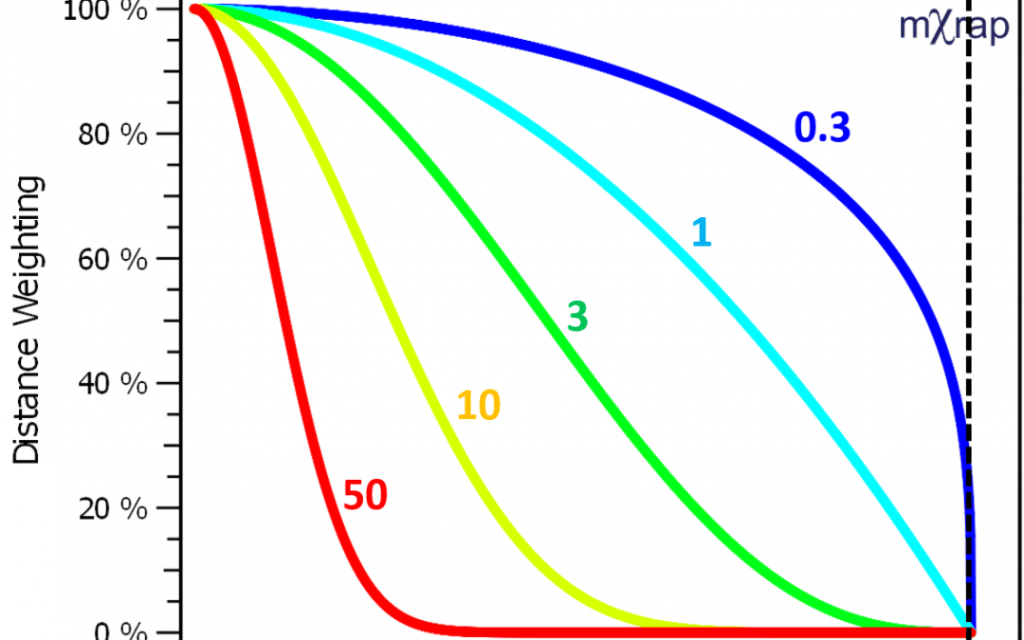
Sensitivity Analysis in Hazard Assessment app

A new window has been added to the Hazard Assessment app (Figure 1). The sensitivity analysis aims to quantify the effect of the variation of the input parameters on the hazard. These analyses can also help the user to determine the optimal settings to use for many of the parameters. This window allows the user […]
Updates to Short-term Response Analysis

There have been a number of recent updates to the Short-term Response Analysis app. These include: Chart for determining re-entry using different parameters: This chart gives you values for a particular parameter over time (based on a user-defined time window size and step). A threshold value for that parameter can be set, allowing you to […]
HW–FW filter
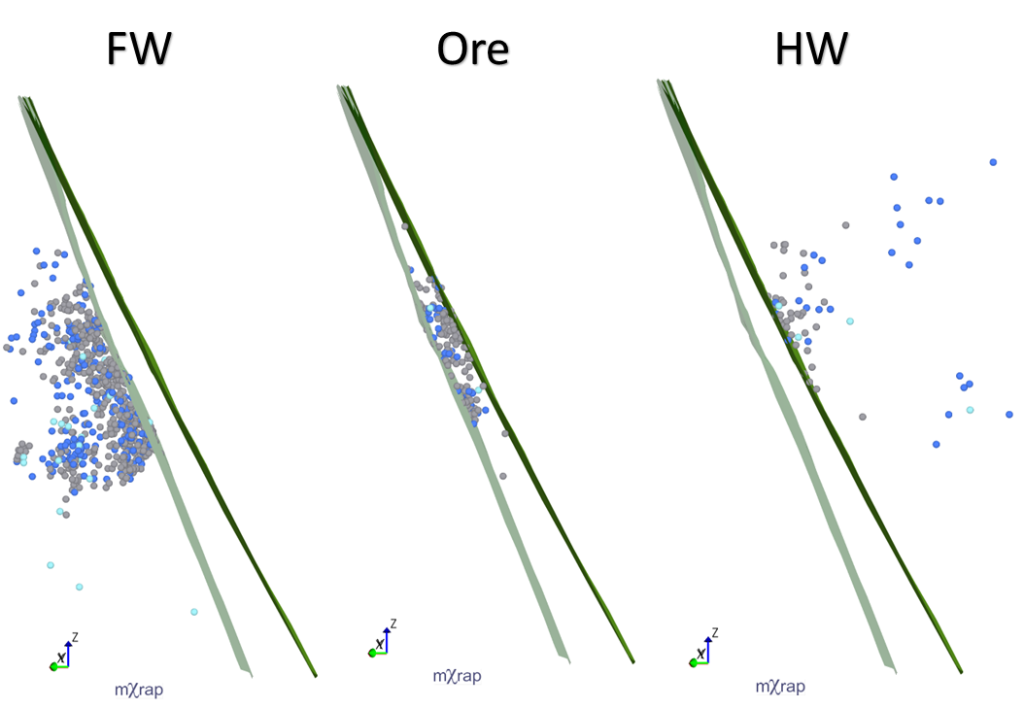
For a few months now, a new tool has appeared in the General Analysis app; the hanging wall (HW) and footwall (FW) filter. The HW–FW filter allows you to filter your events based on where they are in relation to ticked survey/s. If more than one survey or plane is used for the HW–FW filter, […]
Energy – moment relationship
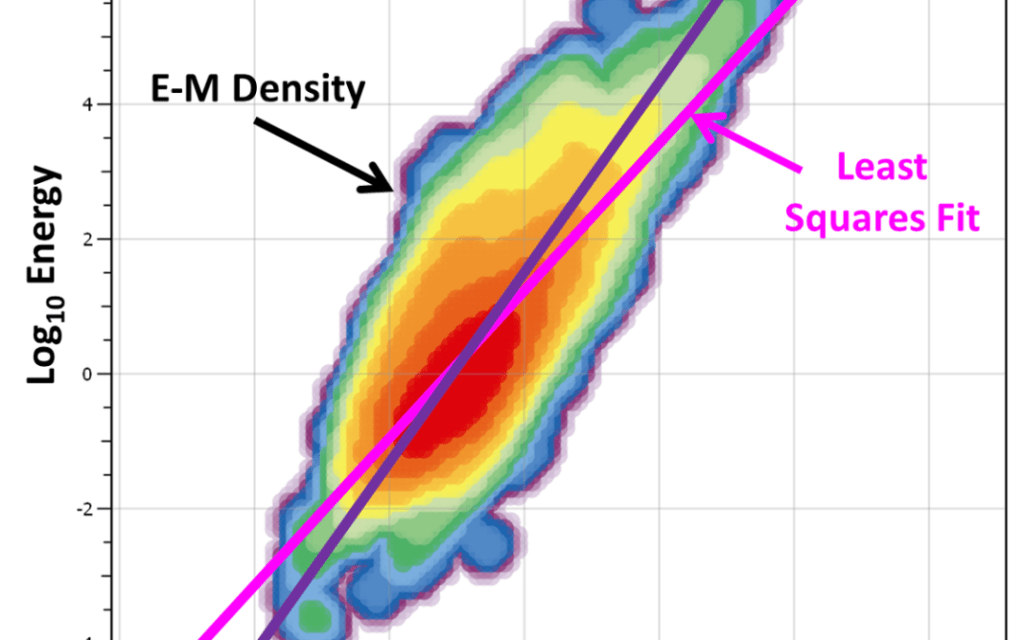
Energy and moment are two independent measures of the strength of a seismic event. Their physical meaning and how they are calculated was described in a previous blog post. Analysis of the relationship between the energy and moment of events can provide insight into seismic sources. For example, blasts or ore pass noise, falsely processed […]
Updates to large event analysis
The Large Event Analysis app has receieved a number of upgrades recently. These upgrades focus on analysing seismicity in the immediate time before/after a large event. A new window, called ‘plane based analysis’, allows the user to investigate the source parameters around the location of an event before/after it occurred. The analysis conducted is the […]
Updates to the Grid Based Analysis app
There are a number of updates to the Grid Based Analysis app. The first is the ability to use multiple planes for analysis instead of just a single plane. You can also now choose up to two dynamically generated planes, instead of just the saved planes. There is a new chart called ‘grid results distribution’ […]
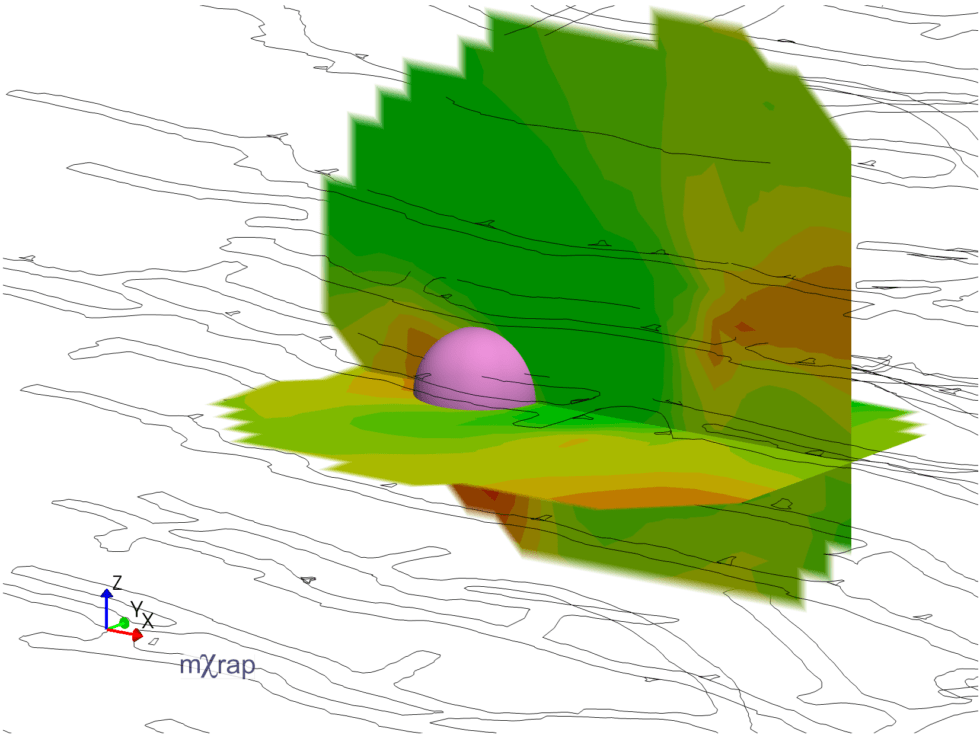
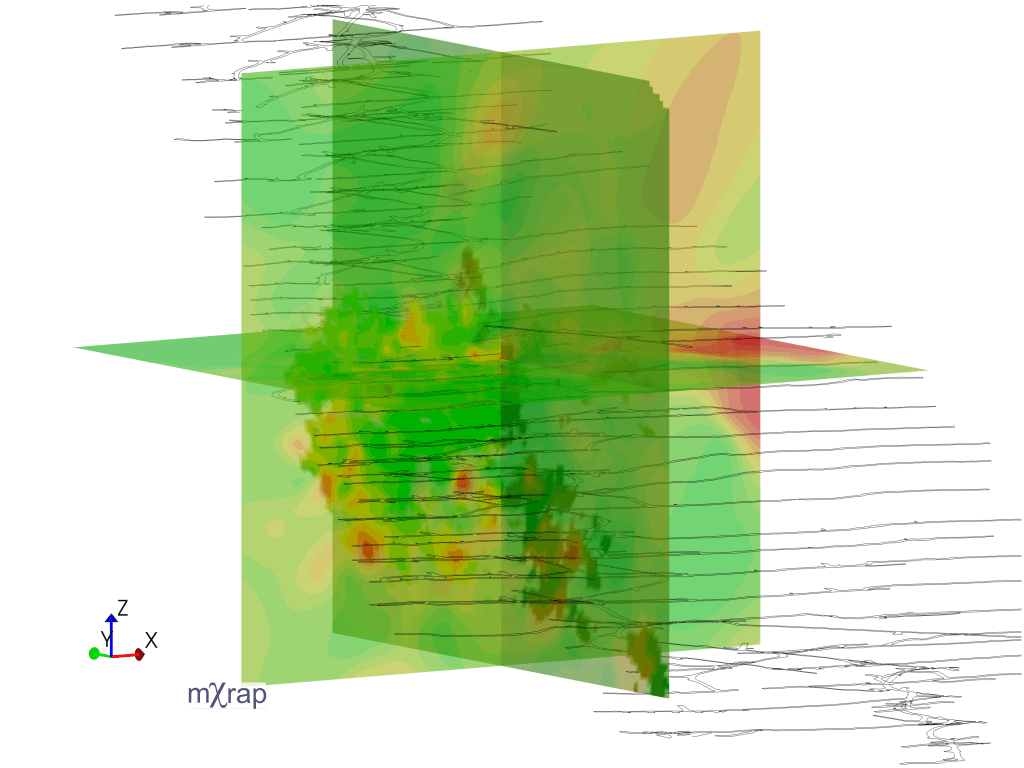
Grid Based Analysis parameters
The Grid Based Analysis application can be used to evaluate the spatial distribution of various seismic parameters. There are a range of source parameter options available, and they can give indications to the rock mass behaviour. Some parameters can be considered as a proxy (stand-in) for rock mass stress, while other parameters can be a […]
Updates to Hazard Assessment app
A few new features have been added to the Hazard Assessment application, aiming to improve usability, understanding and investigation. The first addition is a chart in the hazard setup window to indicate the current date range settings. Usually the date range for calculating b-value will be a lot longer than for calculating event rate. Hopefully […]
