Energy and moment are two independent measures of the strength of a seismic event. Their physical meaning and how they are calculated was described in a previous blog post. Analysis of the relationship between the energy and moment of events can provide insight into seismic sources. For example, blasts or ore pass noise, falsely processed as real events, tend to have distinct zones on an energy-moment chart. In general, events with higher-than-average energy are associated with high relative stress.
Energy index is a parameter used to estimate effective stress. To calculate energy index, the mean energy-moment relationship must be defined. Energy index is the log difference in energy from the mean energy-moment relationship. When comparing energy index in different software or from separate sites, it is important to note that if the energy-moment relationship is not the same, the energy index will not be consistent.

The most common method of fitting a linear relationship between two variables is known as least squares regression (LSR). This method essentially minimizes the vertical (Y-axis) difference between the data points and the line of best fit. For the energy-moment case, this would be minimizing the energy difference. LSR is designed for cases where the independent variable (X-axis) is known perfectly (zero error) and the error is only associated with the dependent variable (Y-axis). This is not suitable for the energy-moment case as there is uncertainty in both the energy and moment parameters. The uncertainty in moment and the uncertainty in energy are also generally not the same scale.
There are several linear regression methods that account for uncertainty in both parameters. Orthogonal regression minimizes the perpendicular difference between the data and best fit line, assuming a constant ratio between the X and Y variances. There is also a method known as weighted least squares which does not assume a correlation between the uncertainty of the two variables. A less complicated approach is to use the quantile-quantile (QQ) plot of the data. This plots the smallest energy against the smallest moment, the second smallest energy against the second smallest moment, etc. This approach has the effect of normalizing the different scale variances of each parameter. The ordinary LSR method can then be applied to the QQ data to obtain an accurate line of best fit. This is equivalent to the orthogonal regression method.
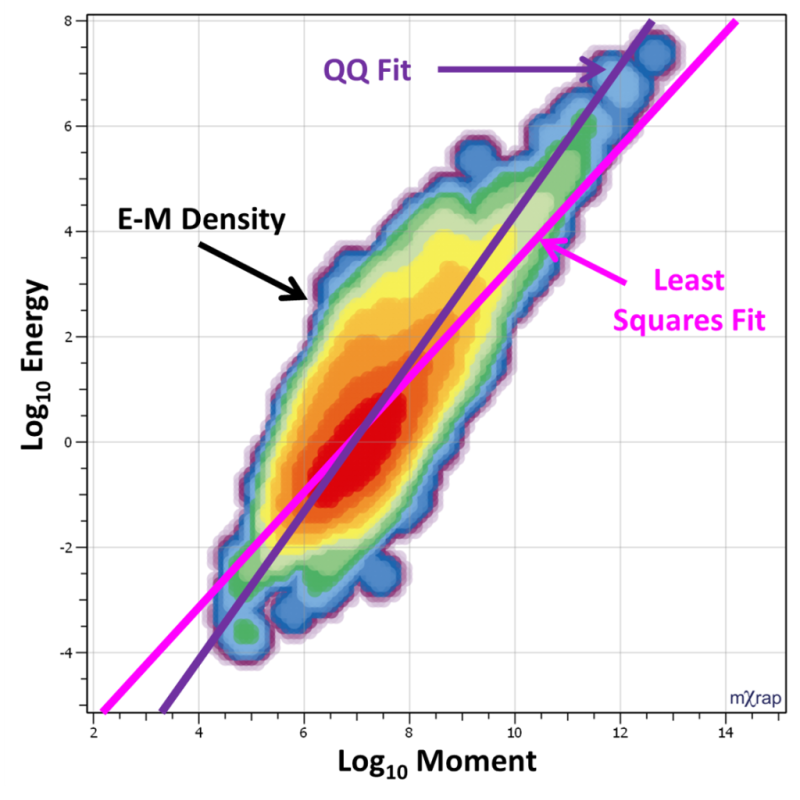
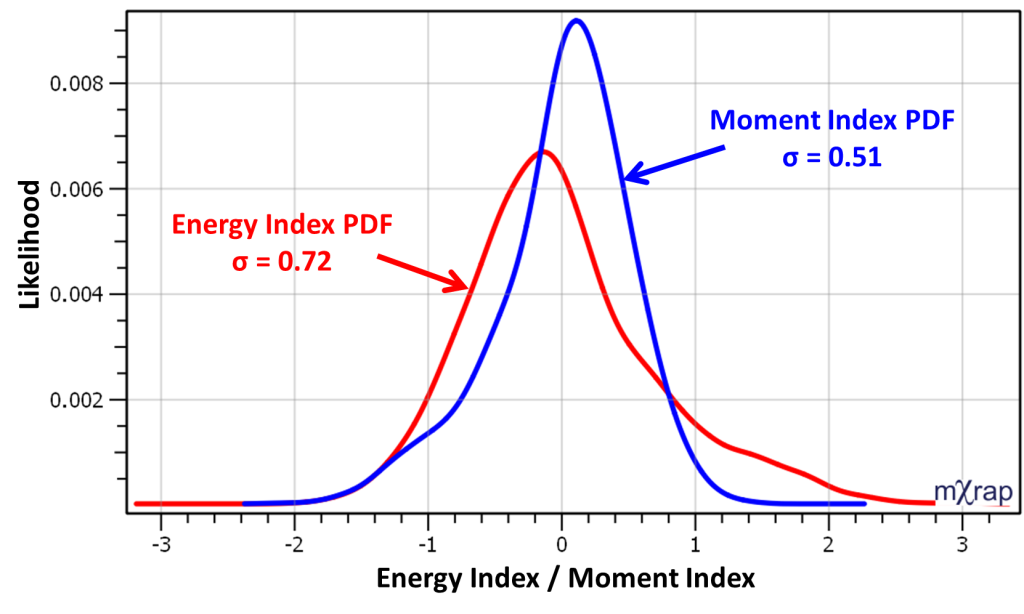
The figure below shows the difference between the QQ fit and the least squares fit of the energy-moment data at the Tasmania mine. The QQ fit is a better match to the highest point density zones. The poor LSR fit is because the variance in energy is higher than the variance in moment. The distribution of the energy and moment departure indices is plotted below. Both distributions are slightly asymmetrical, likely due to the various seismic mechanisms superimposed. The wider variance in the energy index introduces a bias that has the effect of making a shallower least squares fit as it tries to minimise the vertical departure in the centre of the chart.
If you are doing your own energy index calculations, or using different software, you should be aware of the method used to define the energy-moment relationship and the linear constants used. The least squares approach or chi-square regression should be avoided. The QQ based method is the approach used in mXrap and you can find the fitted linear equation in the footer of the energy-moment chart. You might see different parameters for “global” energy index and “local” energy index. This distinction comes from the different energy-moment relationships used. The global EI relationship is based on all events that pass the quality filter. The local EI relationship is based on events that pass the current base filter (volumetric, parameter ranges etc.).