

There have been a number of recent updates to the Short-term Response Analysis app. These include:
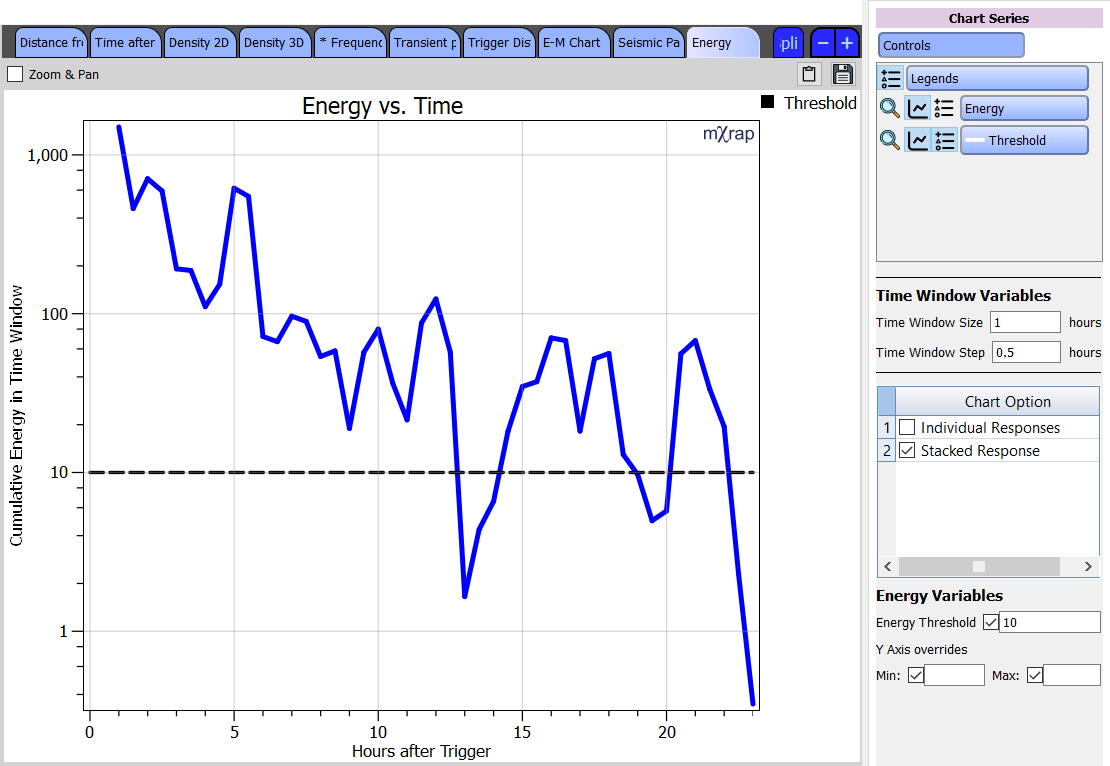
- Chart for determining re-entry using different parameters: This chart gives you values for a particular parameter over time (based on a user-defined time window size and step). A threshold value for that parameter can be set, allowing you to see when the seismic data drops below that threshold. The parameter investigated can currently be set to energy, event count, hazard, background ratio and activity rate probability. For more information about these parameters, see Tierney et al. 2019.
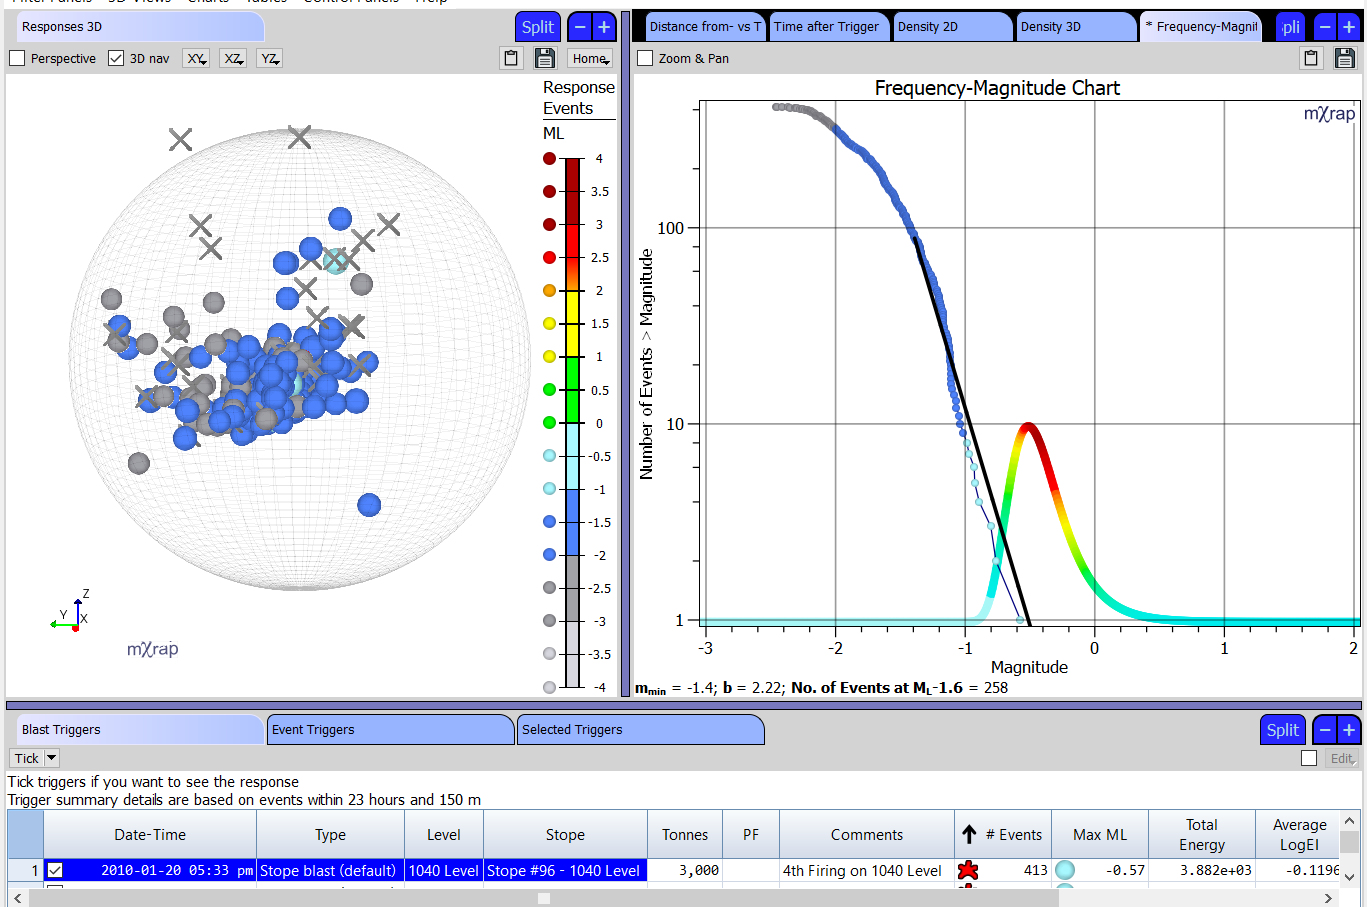
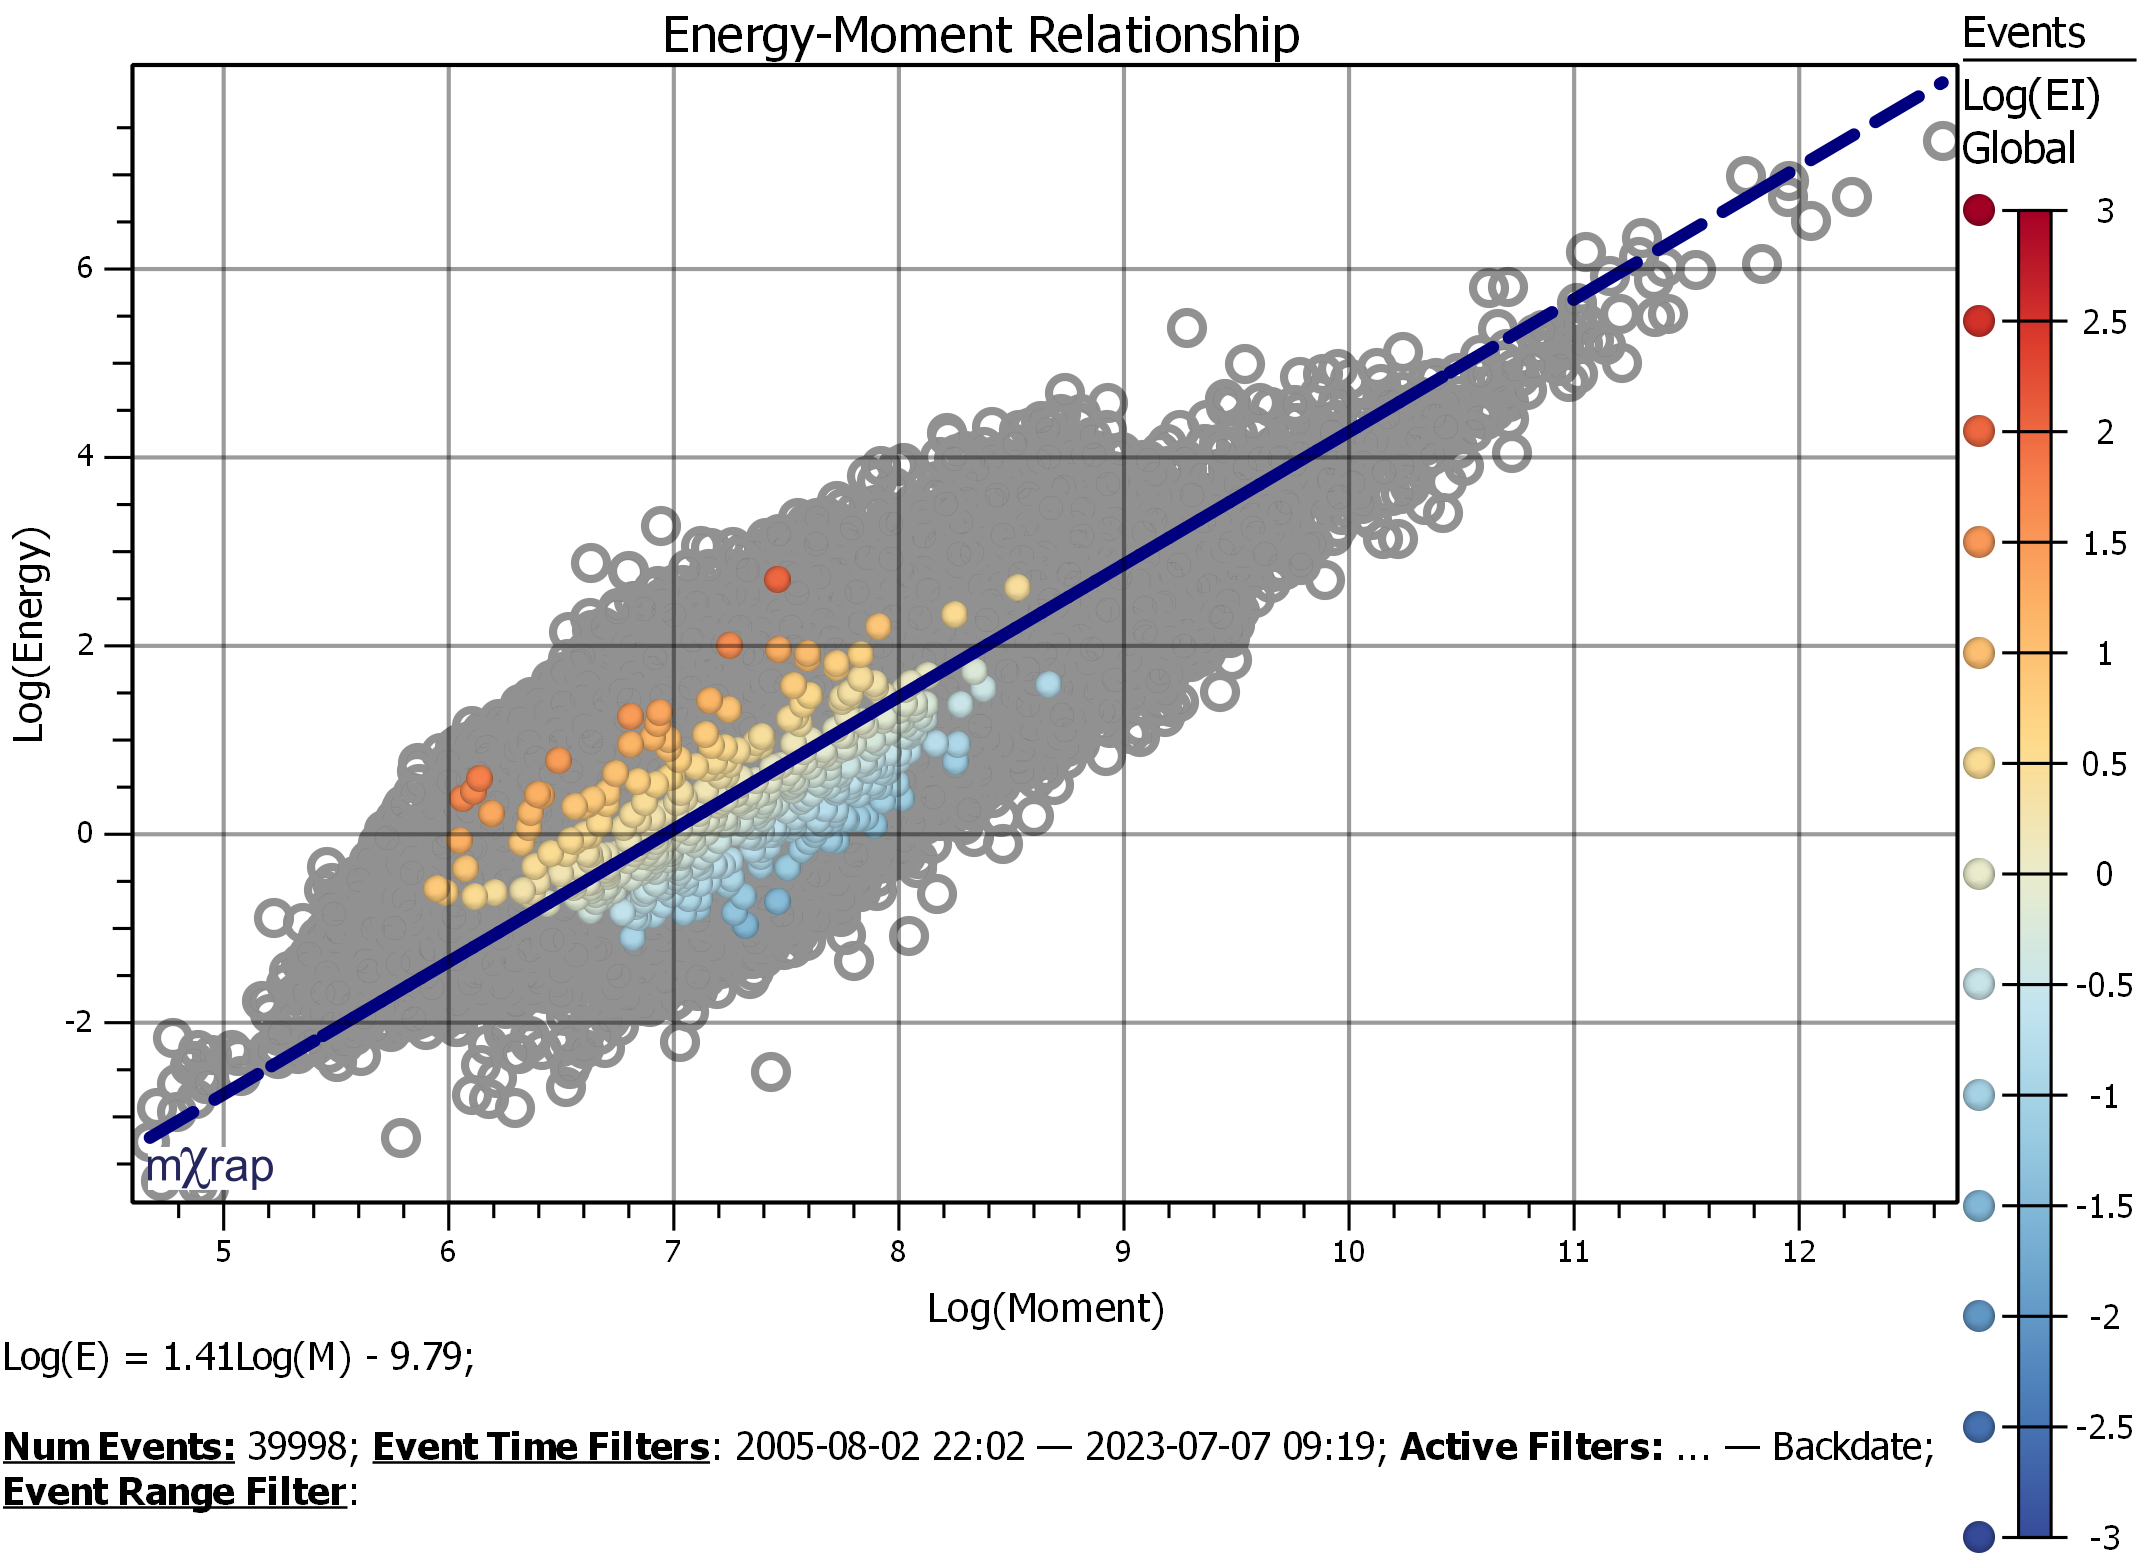
- Frequency–magnitude and log energy–log moment charts for response events: This allows you to do more detailed analysis of responses, to try to understand the underlying mechanism of the response and the distribution of events.
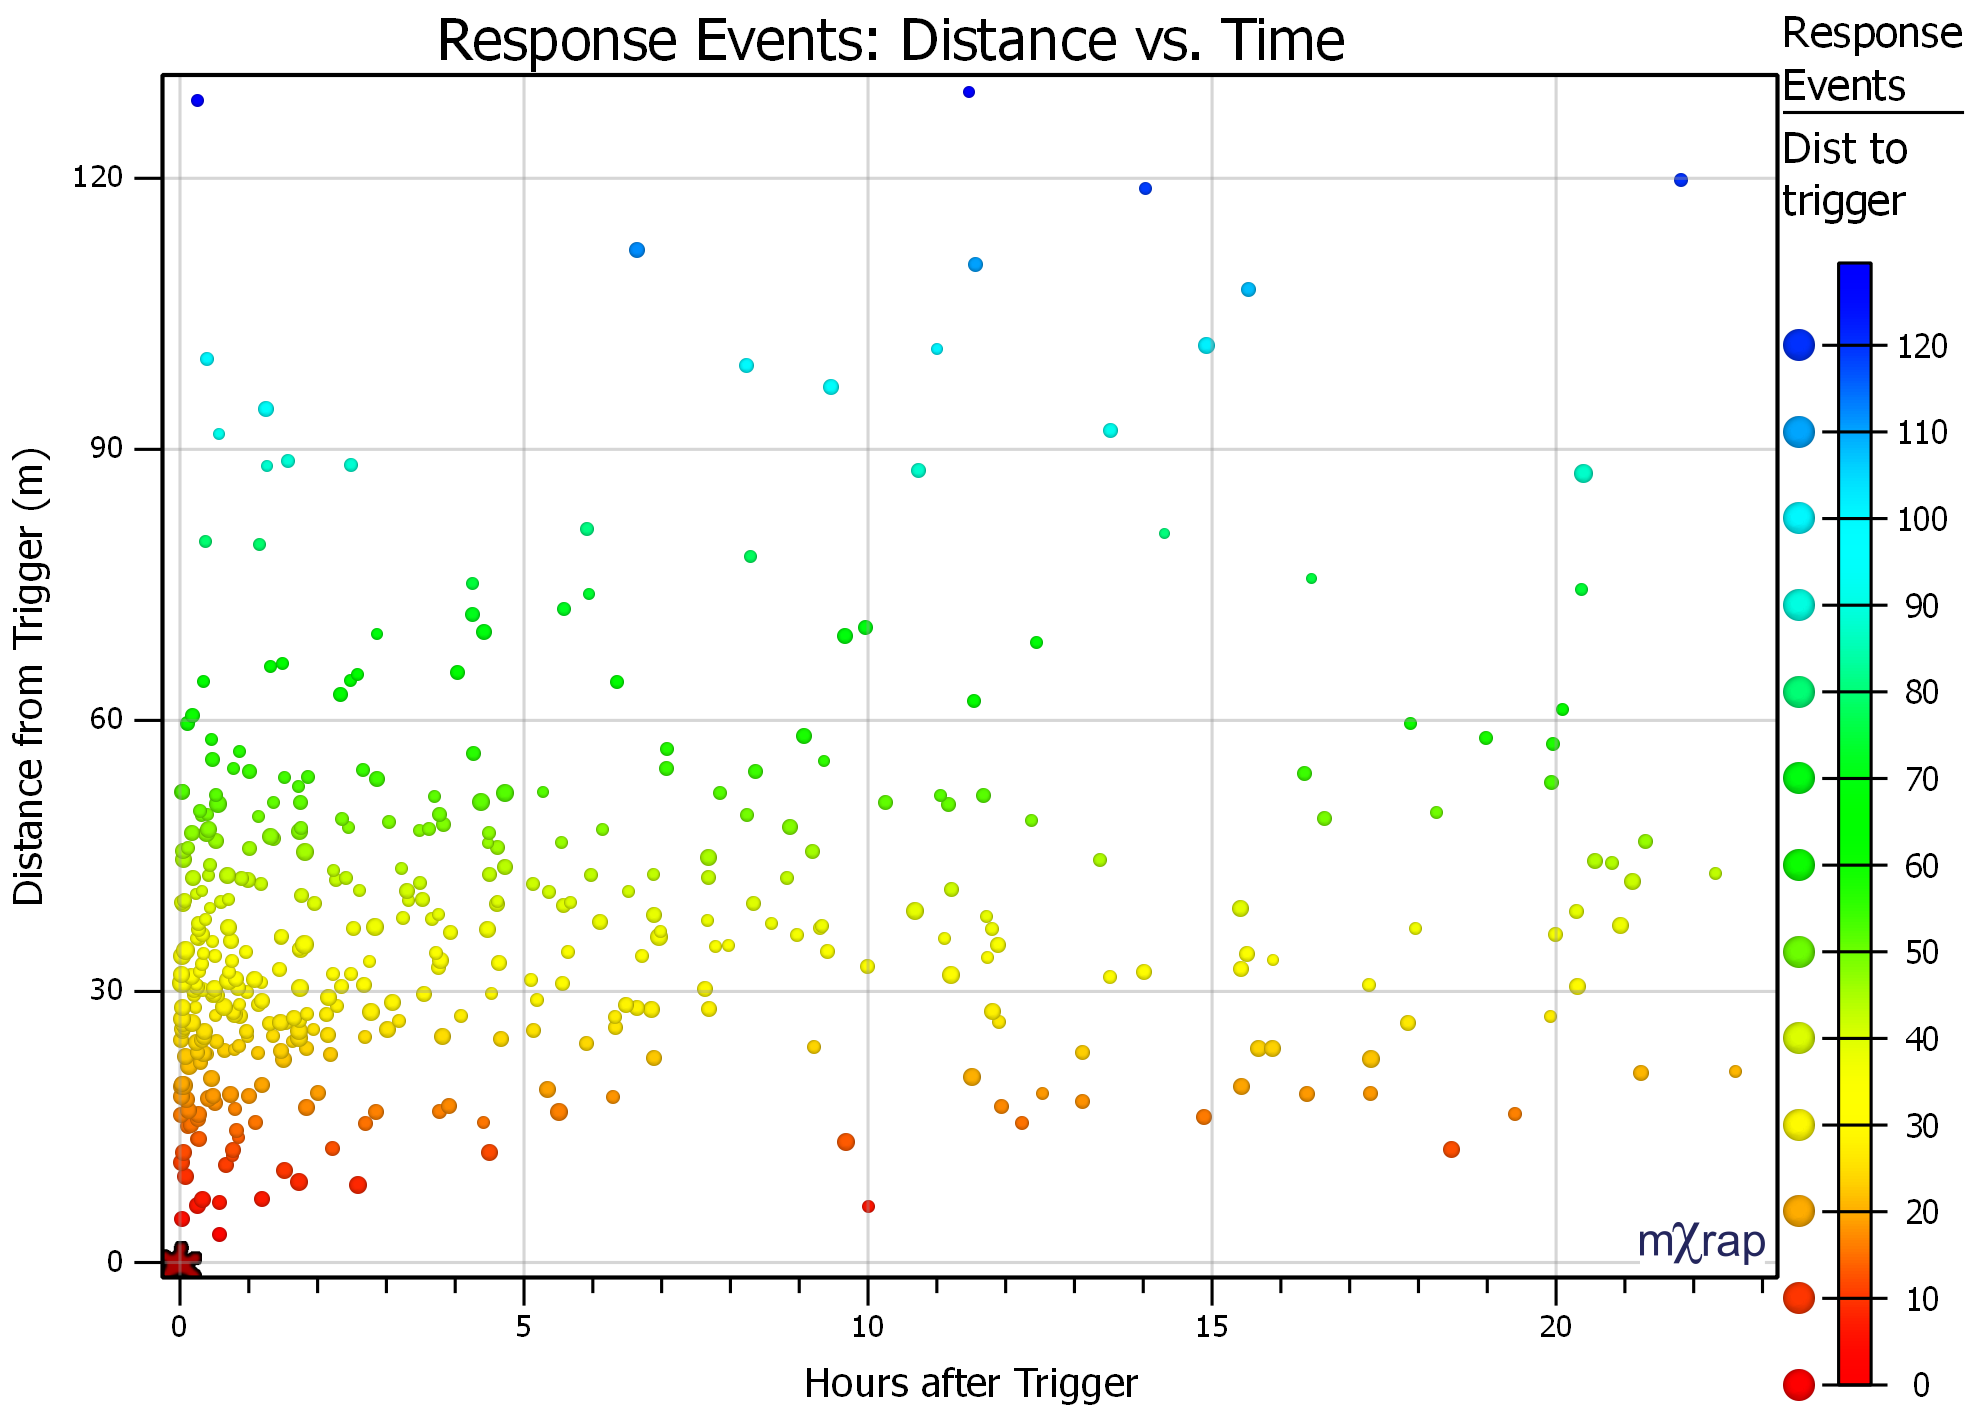
- Time versus distance to trigger chart: This allows you to investigate whether there are trends in your response seismicity dependent on the distance from the trigger.
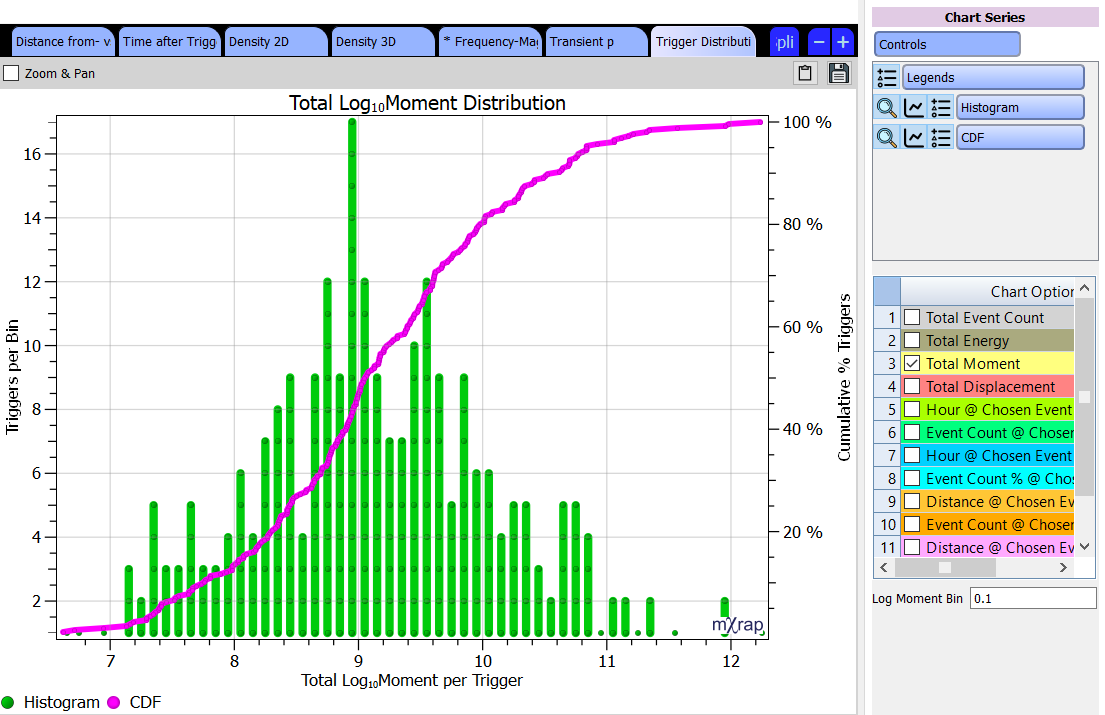
- Trigger distributions chart: This is for allowing you to analyse the distribution of selected triggers, to help you make better decisions as to what criteria to use for re-entry and at what level that criteria should be set
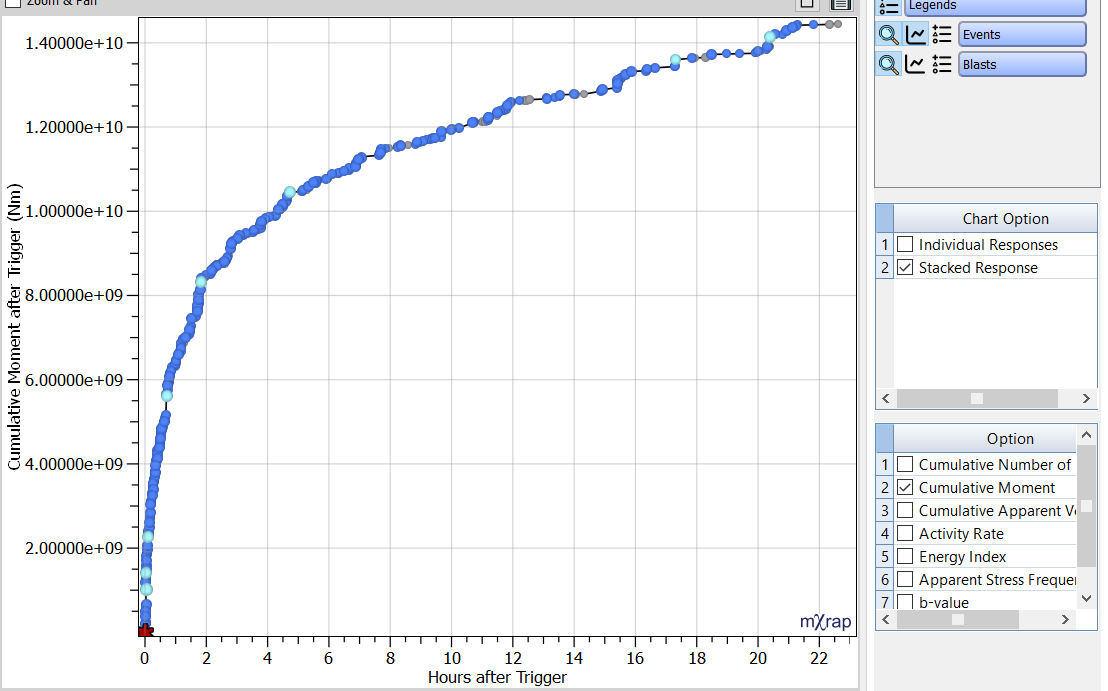
- Charts for analysing cumulative distributions of parameters: This is for allowing you to see the full distribution of seismic event parameters for a trigger (or multiple selected triggers). The parameter investigated can currently be set to cumulative number of events, cumulative moment, cumulative apparent volume, activity rate, energy index, apparent stress frequency and b-value.
If you need a root upgrade to see these charts or have any questions on their use, please contact the support email address for help.
