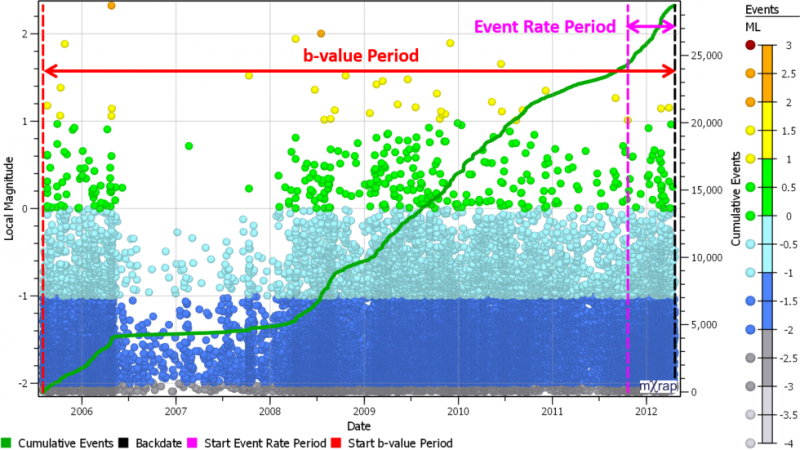
A few new features have been added to the Hazard Assessment application, aiming to improve usability, understanding and investigation. The first addition is a chart in the hazard setup window to indicate the current date range settings. Usually the date range for calculating b-value will be a lot longer than for calculating event rate. Hopefully the chart will be a handy visual aid to help you keep your bearings when setting the hazard analysis periods.
There are also two new windows under the “Hazard Assessment/Advanced Tools” tab. The basic hazard assessment tools are designed to be as simple as possible, requiring minimal user interaction. This makes it easy for new users to get results, the trade-off being there are limited ways to adjust the analysis if required. The new advanced tools will allow users greater control over some of the analysis parameters. Be aware though, the default control parameters have been carefully chosen and there is interaction between different parameters, i.e. changing one parameter may mean others should be tuned also. This should only be done by experienced users familiar with the analysis process.
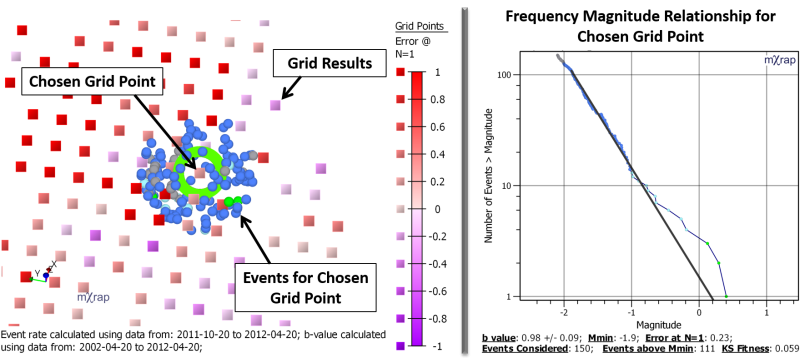
The first new window is for investigating the frequency-magnitude (FM) relationships used in the hazard calculations. You can pick any grid cell to view the frequency magnitude chart of events found in the local area. This is the b-value used for this grid point. The b-value is a very sensitive parameter in hazard calculations, and there are cases where the automatic FM modelling algorithm may not work well. There are several markers to help identify potential areas where the FM model may not represent the data accurately:
- Mmin – the magnitude of completeness, above which all events are recorded.
- b-value Standard Error – b/√NMmin. Note: this does not describe the deviation of data from the FM model, but a measure of uncertainty in the b-value.
- Error at N = 1 – Crude goodness of fit measure, the difference between the largest event and the ‘a/b’ value. Note: it isn’t necessarily an ‘error’ for there to be a difference here. The ‘a/b’ magnitude is the maximum likelihood for the largest event in the FM model, but it has a wide distribution of possible magnitudes.
- KS Fitness – Kolmogorov-Smirnov goodness of fit measure, describing the probability that the data is a sample of the underlying FM model. The KS value itself is like the p-value in a null hypothesis test, i.e. the probability the data does not follow the distribution. A KS test below 0.05 would be good fit, 0.05-0.1 would be a mediocre fit, and above 0.1 would be a poor fit.
A few of the control parameters related to grid-based b-value calculations have been exposed in this window. Users can limit the potential range for the grid Mmin and define the search parameters for assigning events to each grid point:
- Rmax – The maximum distance to search for events around the grid point. No events outside this range will be used.
- Limit Search N – All events within the Rmin (Rmin = grid spacing) are assigned to the grid point. After that, increase the search radius until there are this many events or Rmax is reached. If more than this many events have been considered, it means there were more than this many events within Rmin. If less than this many events have been considered, it means Rmax was reached.
- Min N above Mmin – At least this many events must be above the Mmin of the grid point FM. If there are less events than this, no b-value and no hazard is assigned to this source.
There is also an extra quality check to ensure that events are representative of the local source, and not simply a result of an expanded radius into a separate source. A quality cut-off distance is used, where at least 10 events must be within this shorter radius of the grid point.
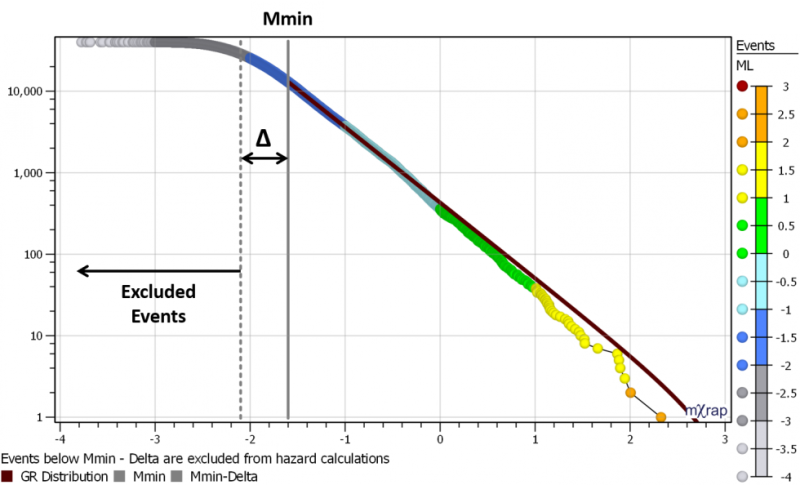
In the same window there is also a global frequency-magnitude chart. This uses all events before the backdate, throughout the whole mine. This shows the Mmin that is used for the event rate calculations. Events well below the global Mmin (Mmin – Δ) are also excluded from the b-value calculations. This is primarily to speed things up. The Δ parameter can be adjusted in the control panel but beware, it will affect the other search parameters. E.g. increasing Δ and including more small events means you will need to increase the search N to ensure you will still get the required number of events above Mmin.
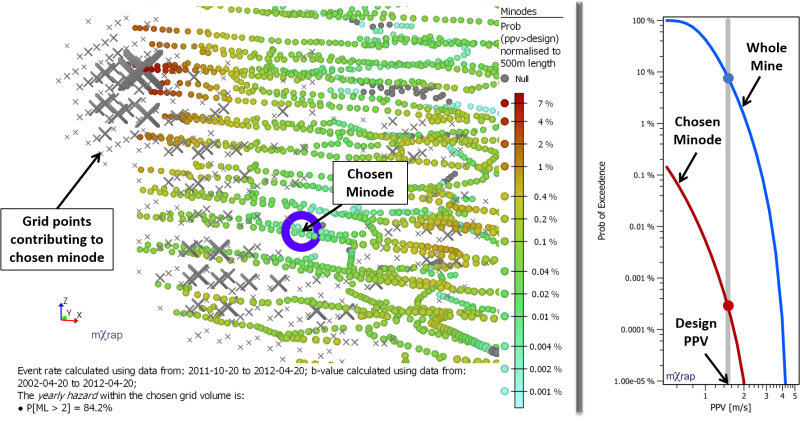
The second new window mostly contains tools that already existed in the hazard app, but were a bit hidden away. This window will probably become a bit of an all-in-one window, with the hazard iso’s and minodes shown together. If you pick a minode in the 3D view, the grid point sources that contribute to the hazard at that minode will be plotted, scaled by how much they contribute. Theoretically, every grid point contributes to the hazard at a minode, but there is an accuracy threshold applied with a minimum probability to speed up the calculations. Increasing the accuracy will result in more contributing grid point sources.
The PPV-Exceedance Probability chart is also shown in this window. This is useful for understanding the effect of integrating the hazard of multiple minodes together. The probability of exceeding the design PPV increases depending on how many minodes are considered. You can use selection boxes to query any group of minodes you like.
The Strong Ground Motion Relationship window has also been upgraded a little. You can now plot the relationship in a couple of different ways:
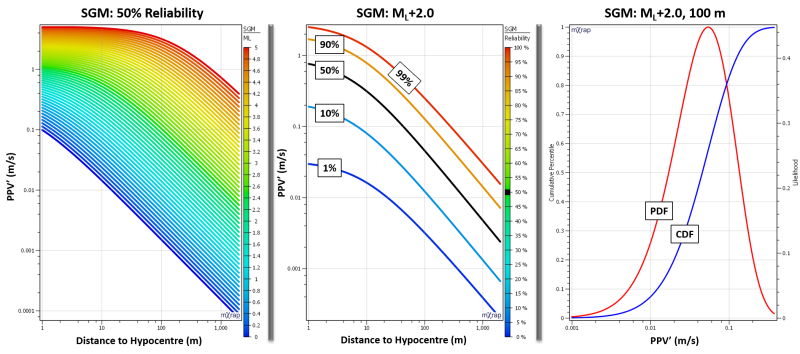
- Single Reliability (P) – This is the most traditional way of viewing the SGM relationship. The PPV is plotted against the distance to hypocentre (R) for various magnitudes. This chart uses a single reliability / probability of non-exceedance. Adjust the reliability in the control panel. Note: Probability of exceedance = 1 – Reliability.
- Single ML – Plot PPV vs. R for various reliability levels (up to 4 levels plus the 50% line). Adjust the chosen ML from the control panel.
- Single ML, R – Plot the PDF and CDF for a particular ML and R combination. Adjust the chosen ML and R from the control panel.
These updates will be included in your next root folder upgrade. If you would like to arrange a root upgrade, please contact us at our support email address.