- Click here to read the latest mXrap news.
- The mXrap User Case Studies for Mines Seminar will be held alongside Deep Mining 2024 in Montreal Canada. Visit the ACG events page to view upcoming courses and conferences.
Ph: (+61 8) 6488 3300
E-mail: info@mxrap.com
Visit us at
Australian Centre for Geomechanics
The University of Western Australia
Civil and Mechanical Engineering Building
Room 273, Level 2
Fairway Entrance 3
CRAWLEY WA 6009
Postal Address
mXrap development
c/o Australian Centre for Geomechanics
The University of Western Australia
35 Stirling Highway (M600)
Crawley WA 6009
AUSTRALIA
ABN 37 882 817 280

Sign up for mXrap news

We have recently updated the JavaScript library mxjs/base/algorithms/filter_volumeset.js to be more efficient. If you are using this library and call…
The export panel, located on the right-hand side of 3D views, charts and tables, can be used to generate images,…
We’re pleased to announce the release of mXrap version 6, bringing with it a range of enhancements to elevate your…
mXrap version 5 will stop working in May. We will be transitioning everyone to mXrap version 6 before then. As…


- All
- Backfill
- Basic Seismic Monitoring
- Caving
- Chart of the Day
- Damage Mapping
- Developer
- FAQ
- General
- General Analysis
- Grid Based Analysis
- Large Event Analysis
- mXsync
- Playground
- Rock Mass Data
- Seismic Hazard
- Short-term response analysis
- Source Parameters
- Support
- Tips and Tricks
- Training
- Uncategorized
- Updates
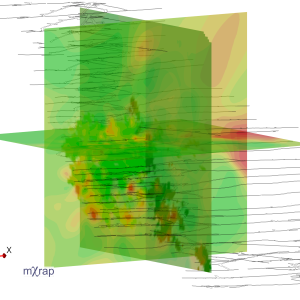
There are a number of updates to the Grid Based Analysis app. The first is the ability to use multiple planes for analysis instead of just a single plane. You can also now choose up to two dynamically generated planes, instead of just the saved planes. There is a new chart called ‘grid results distribution’ […]
The Grid Based Analysis application can be used to evaluate the spatial distribution of various seismic parameters. There are a range of source parameter options available, and they can give indications to the rock mass behaviour. Some parameters can be considered as a proxy (stand-in) for rock mass stress, while other parameters can be a […]
A few new features have been added to the Hazard Assessment application, aiming to improve usability, understanding and investigation. The first addition is a chart in the hazard setup window to indicate the current date range settings. Usually the date range for calculating b-value will be a lot longer than for calculating event rate. Hopefully […]