


Update to Paste Backfill Design app
We have made a couple of changes to the Paste Backfill Design application since the original release. See the previous blog post for the main details of the app. Since the first release, we have modified the paste volume calculations to allow for multiple pouring locations and beach angles. This will be helpful for cases where there is an initial waste rock dump in the stope. The video below demonstrates a scenario where the stope

NEW APP – Paste Backfill Design
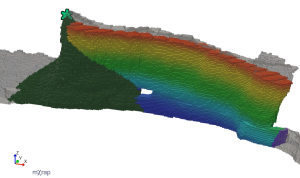
We have developed a new app to aid in the design of paste backfill in stoping operations. The app has tools to help you to: If you would like to try out the app, please contact our info email. Paste volumes The paste volume calculations use the mine geometry app to input surveyed geometry. Walls/barricades and bunds can be added to the geometry. Paste is deposited into the geometry from a specified pouring location. The
Rock Mass Data Analyser
The Rock Mass Data Analyser (RMDA) application allows a user the ability to input various types of geotechnical data into mXrap, creating a geotechnical database of borehole and mapping data, which may be easily visualised and analysed in 3D, on charts and in stereonets. Thus far, the application has been developed to allow for the visualisation and assessment of: Rock mass quality data e.g. RQD, RMR, Q, Q’, GSI etc. Structural data i.e. joint orientations and
Updates to large event analysis
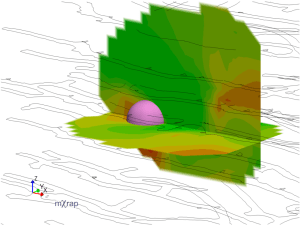
The Large Event Analysis app has receieved a number of upgrades recently. These upgrades focus on analysing seismicity in the immediate time before/after a large event. A new window, called ‘plane based analysis’, allows the user to investigate the source parameters around the location of an event before/after it occurred. The analysis conducted is the same as that of the planes in grid based analysis, however the time period is centred around the event time.
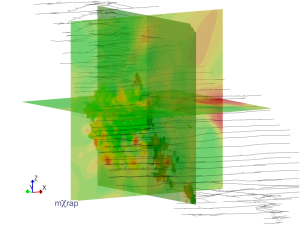
Updates to the Grid Based Analysis app
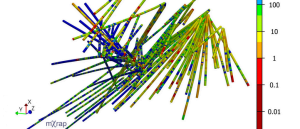
There are a number of updates to the Grid Based Analysis app. The first is the ability to use multiple planes for analysis instead of just a single plane. You can also now choose up to two dynamically generated planes, instead of just the saved planes. There is a new chart called ‘grid results distribution’ which gives both a histogram and cumulative distribution of the grid results so you can dig further into your results.

Grid Based Analysis parameters
The Grid Based Analysis application can be used to evaluate the spatial distribution of various seismic parameters. There are a range of source parameter options available, and they can give indications to the rock mass behaviour. Some parameters can be considered as a proxy (stand-in) for rock mass stress, while other parameters can be a proxy for the amount of deformation. There are also parameters available that are associated with the rock mass mechanism or
