

Plane based analysis
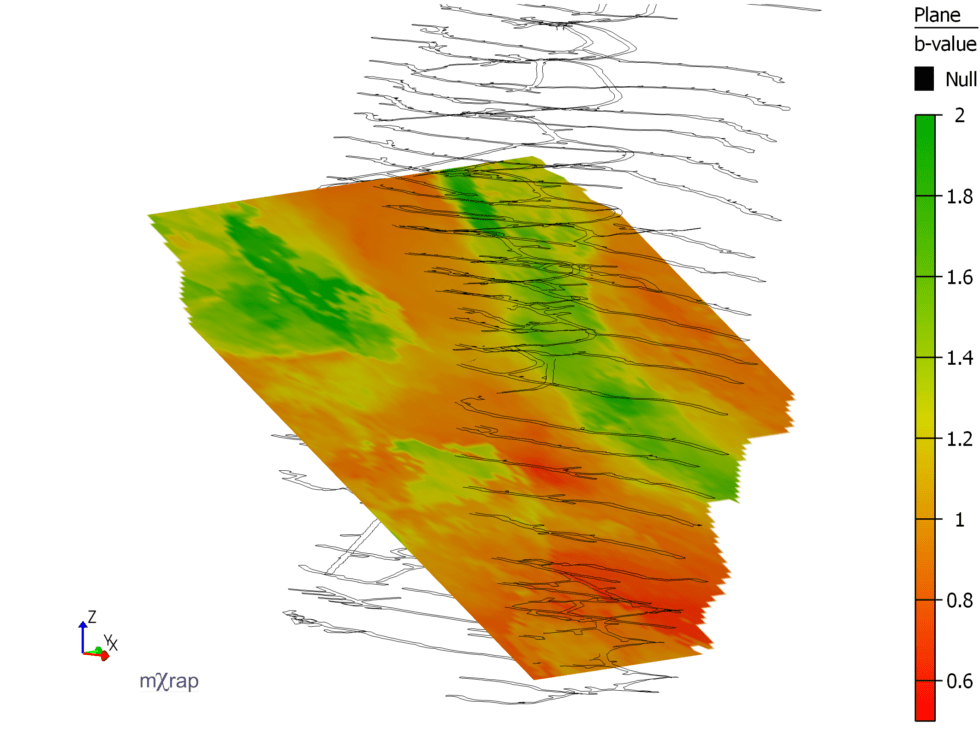
The Grid Based Analysis now has a plane based function. The user can select a plane (defined in the plane editor window) and display cumulative or average parameters on that plane. Like the grid, the average and cumulative parameters are calculated differently. For the average parameters, the plane points are treated identically to the grid […]
Analysing seismicity around large events
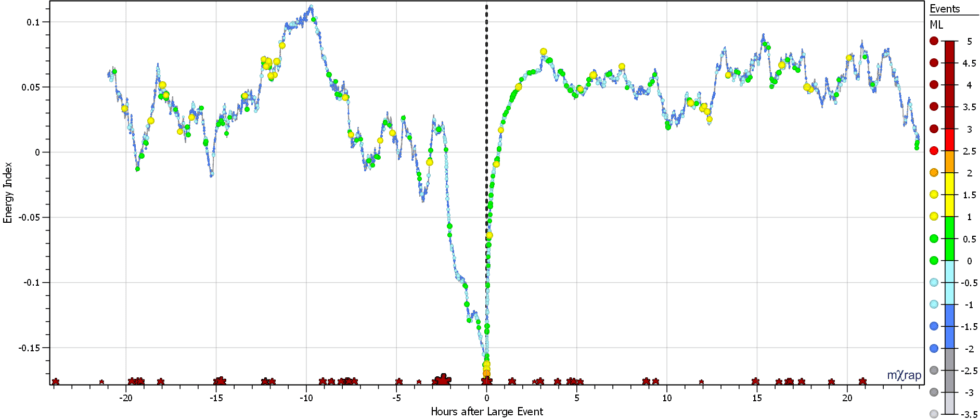
A new window has been added to analyse seismicity in the Large Event Analysis application. In a similar approach to the Short-term Response Analysis app, events are assigned to large events based on a spheroid volume and a time range before and after the large event. The chart below shows the energy index of seismicity […]
New hazard charts in General Analysis
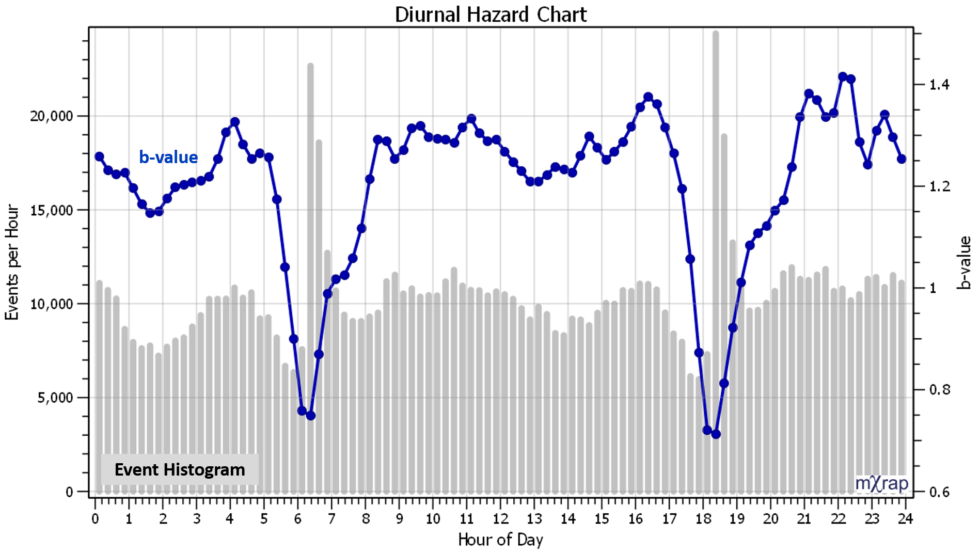
Two new charts have been added to the General Analysis application related to assessing hazard with the frequency-magnitude relationship. The new charts plot various hazard parameters over time, or, by time of day: Charts / Time Series / Hazard over Time Charts / Diurnal / Diurnal Hazard The following parameters can be plotted […]
Background filters in the hazard app
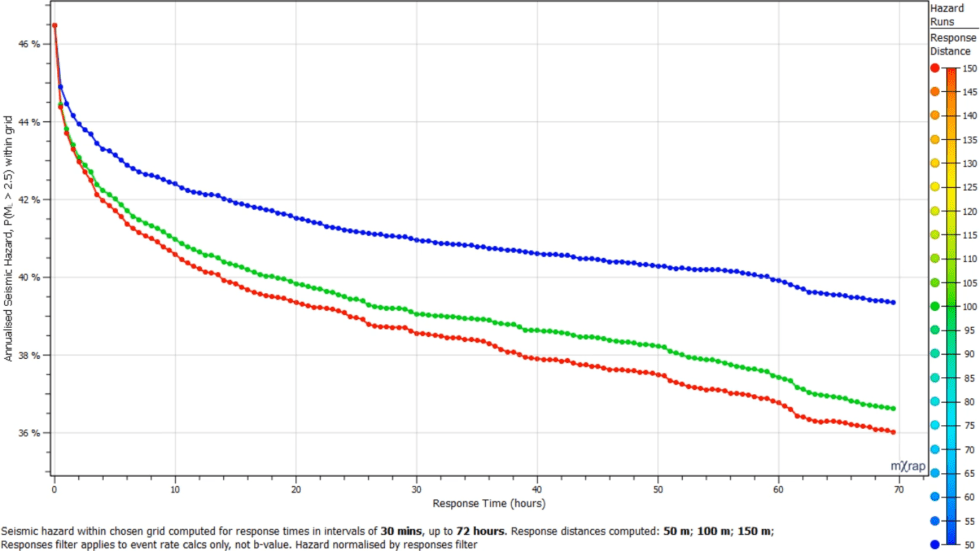
The new background filters have been added to the Hazard Assessment application. The time of day filter can be used to see the effect of removing events during blasting/shift change on the hazard results. You can either view the results in raw or normalised form. The hazard calculations do normalisation for the event rate calcs […]
Stochastic declustering explained
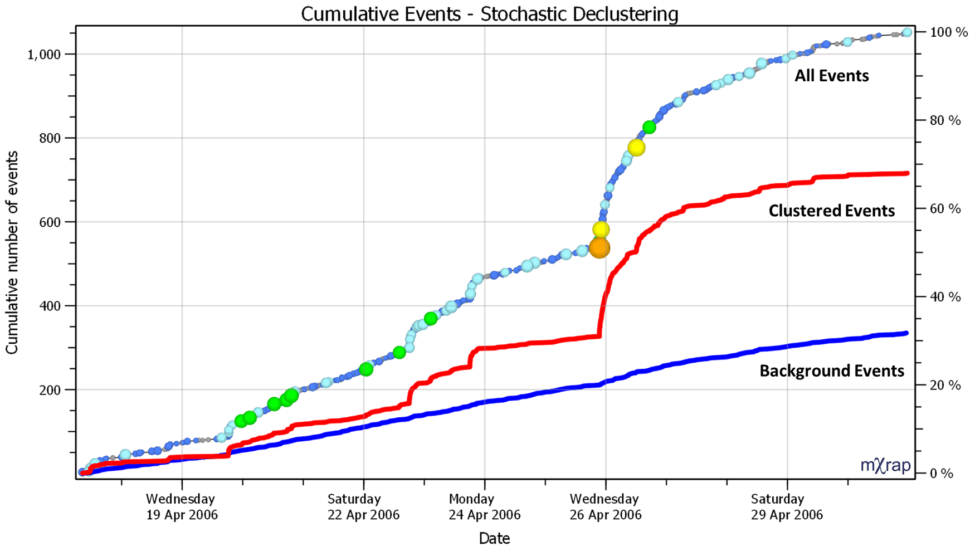
As mentioned in the last blog post, a stochastic declustering algorithm has been implemented in mXrap to separate events into ‘clustered’ and ‘background’ components. It can be useful when designing seismic exclusions and re-entry procedures to separate seismicity that occurs in short bursts from seismicity that has low variability in space and time. Short-term exclusions […]
New background filters
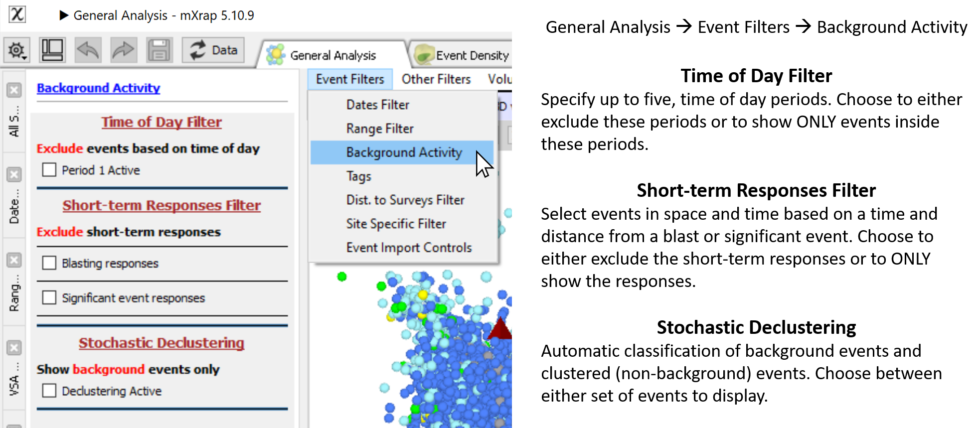
We have added some new event filter options to general analysis related to ‘background’ activity. ‘Background’ events are generally defined as having low variability in space and time. The new background filters aim to identify events that are clustered in space and time and the user can either display the ‘clustered’ or the ‘background’ component […]
Moment tensors – a practical guide
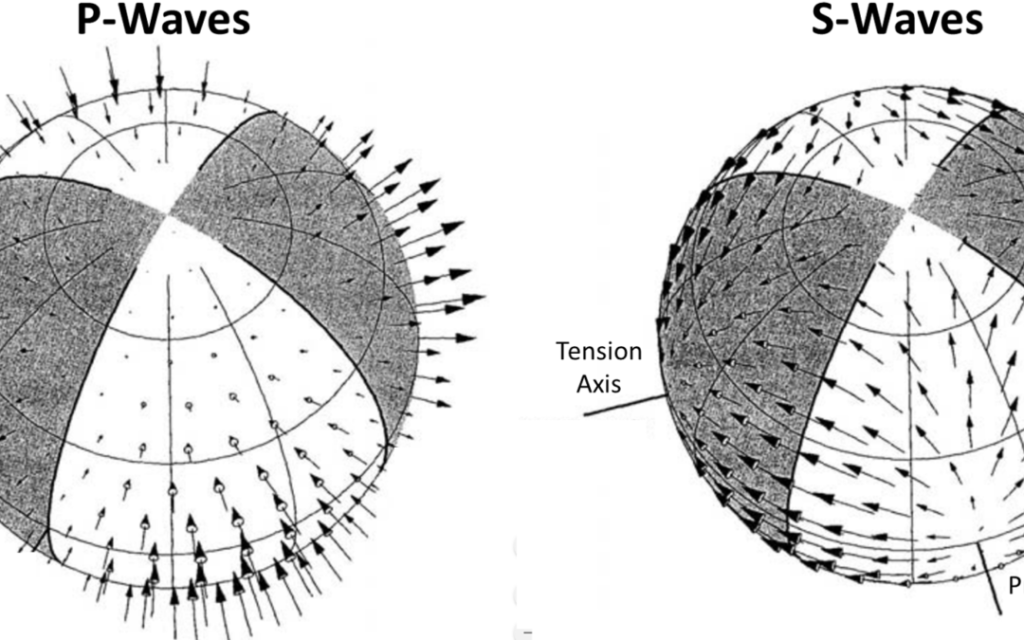
Moment tensor analysis is a topic that carries a decent level of uncertainty and confusion for many people. So I’m going to lay it out as simply as I can. For this post, I’m not going to go into too many details on how moment tensors are actually calculated. But, I’m going to summarise the […]
New b-value isosurfaces
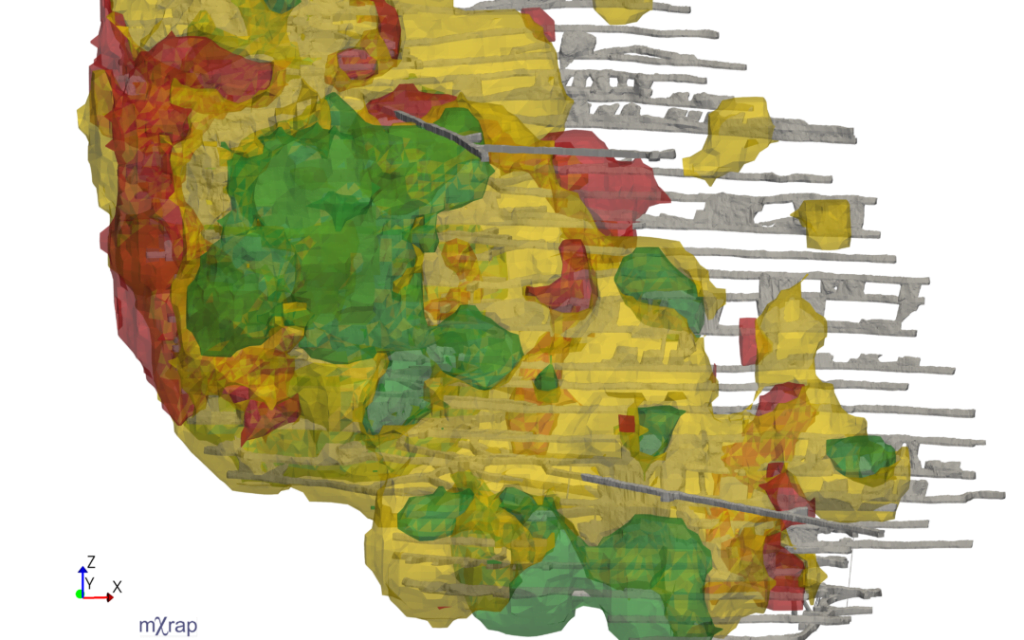
The isosurfaces for b-value have been upgraded in the latest root. There is now much more control over the isosurface levels. Up to 5 iso’s can be plotted for user defined ranges. A linguistic name can be assigned to each level and displayed in the legend. A new video has been uploaded to the Hazard […]
Moment tensors in General Analysis app
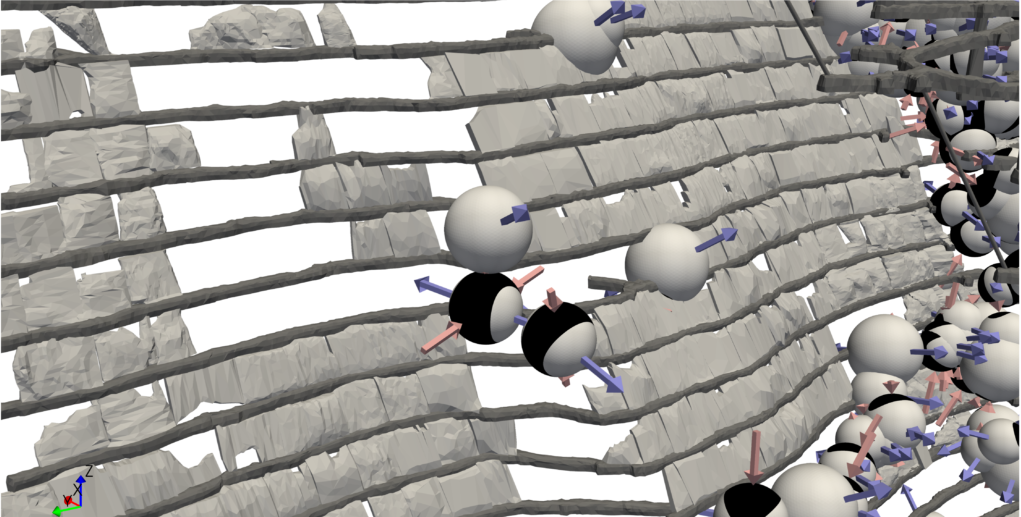
Moment tensors have been added to the General Analysis application in the recent update. Beach balls and principal axes can be viewed in the General Analysis 3D view. There is also a separate Moment Tensor window with a number of stereonets and mechanism charts. Two new training videos have been uploaded to the General Analysis […]
Seismic activity rate monitor
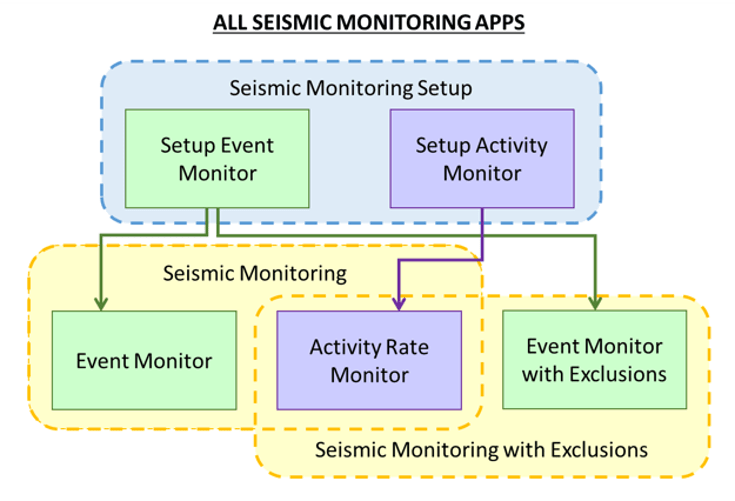
The seismic monitoring applications have been modified in the latest root update. There are now two seismic monitoring applications and a third app for setup. The two different monitoring apps are required because not all sites wanted to use exclusion procedures. The monitoring app with exclusions has a different user interface structure and a few […]
