
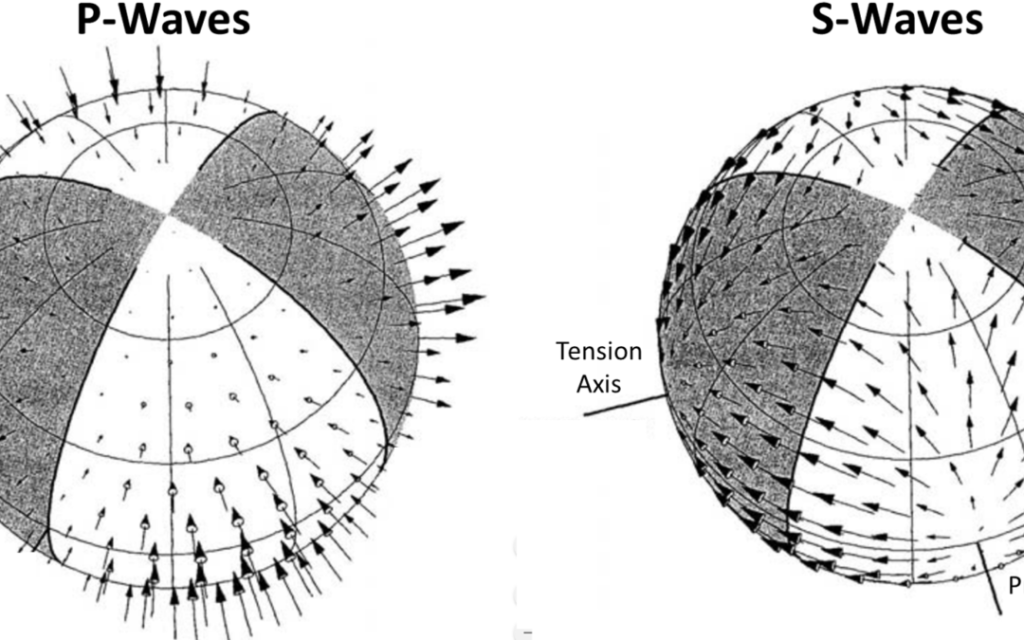
Moment Tensor Axis Colour Update

For users that look at moment tensors, please be aware that we are changing the arrow colours and improving the legend. The colours of the moment tensor T and P axes have been updated to align with the colours used in ESG and IMS system: Red for the P axis Blue for the T axis […]
Grids

Grids are a dynamic tool used throughout mXrap to form seismic populations, perform calculations and display results. Taking time to set-up site appropriate grids not only makes performing analysis in mXrap more efficient, but it enables others to easily replicate your results. Most sites benefit from a mine and/or orebody wide coarse (sparse) and relatively dense grid, plus additional higher resolution (dense) grids for areas of interest.
Es:Ep Ratio Charts Have Moved

Es:Ep ratio charts can now be found in the ‘Parameter Distribution’ charts for the base filter (Charts > Parameter Distributions) and VSA’s (VSA > Charts > Parameter Distributions).
Select the EsEp option under chart controls to see the cumulative distributions for Es:Ep ratio.
Modifying the Imported Tags Meaning

Depending on your seismic monitoring system setup, you may be importing events with different tags into mXrap. When you open mXrap, any events with imported tags ‘b’ and ‘n’ are turned off by default and all other imported tags (e.g. ‘e’) are turned on. If your database contains other imported tags, you can change the meaning (GOOD, OUTLIER, or BLAST) using: General Setup Windows > Event Tag Editor > Imported Tag Meaning.
HW–FW filter
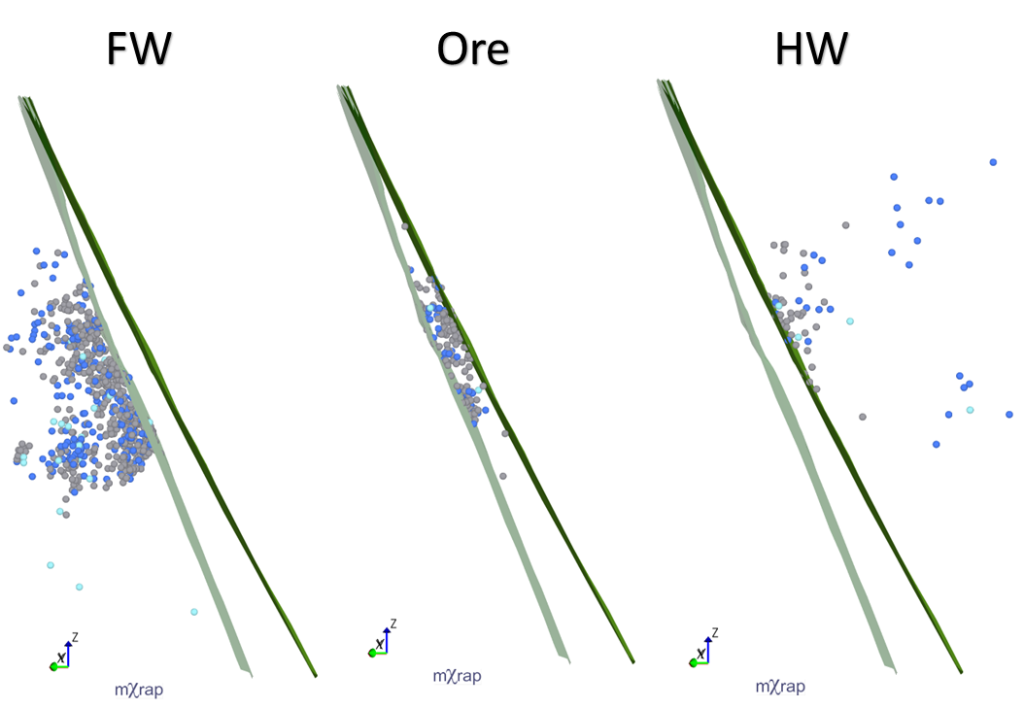
For a few months now, a new tool has appeared in the General Analysis app; the hanging wall (HW) and footwall (FW) filter. The HW–FW filter allows you to filter your events based on where they are in relation to ticked survey/s. If more than one survey or plane is used for the HW–FW filter, […]
Energy – moment relationship
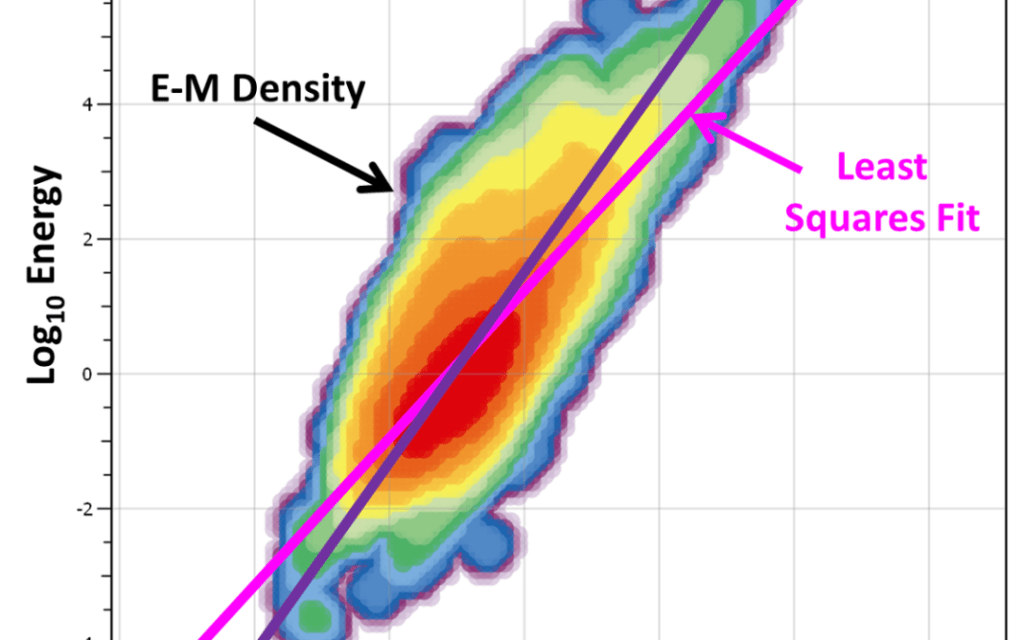
Energy and moment are two independent measures of the strength of a seismic event. Their physical meaning and how they are calculated was described in a previous blog post. Analysis of the relationship between the energy and moment of events can provide insight into seismic sources. For example, blasts or ore pass noise, falsely processed […]
New hazard charts in General Analysis
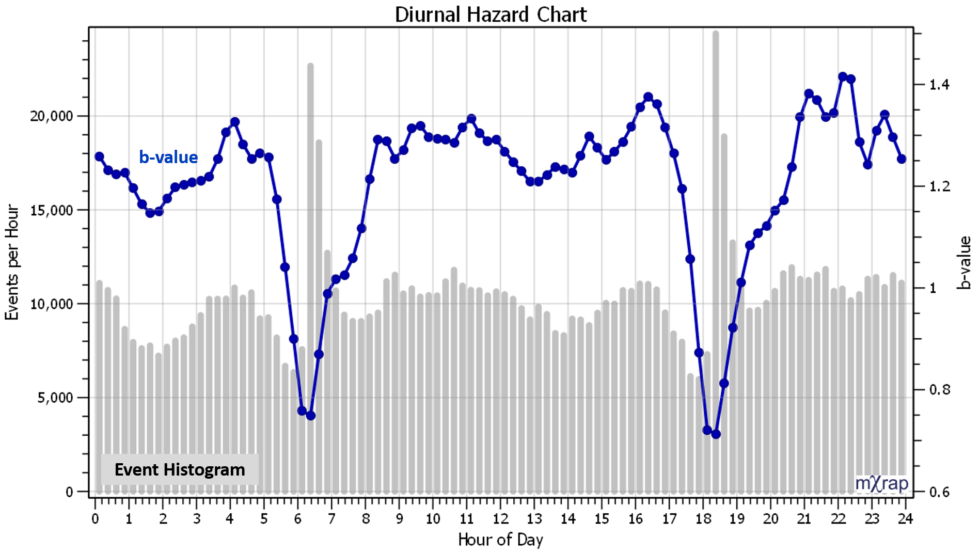
Two new charts have been added to the General Analysis application related to assessing hazard with the frequency-magnitude relationship. The new charts plot various hazard parameters over time, or, by time of day: Charts / Time Series / Hazard over Time Charts / Diurnal / Diurnal Hazard The following parameters can be plotted […]
Stochastic declustering explained
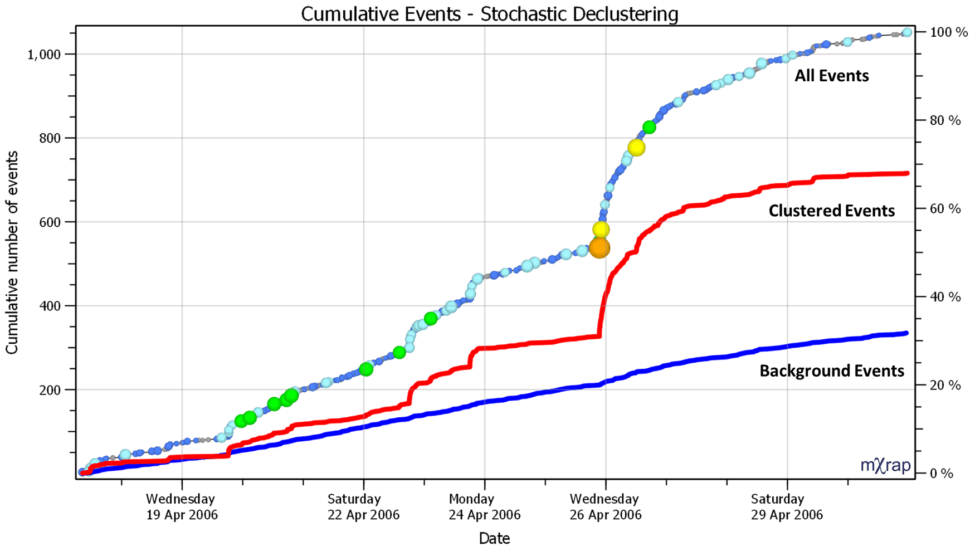
As mentioned in the last blog post, a stochastic declustering algorithm has been implemented in mXrap to separate events into ‘clustered’ and ‘background’ components. It can be useful when designing seismic exclusions and re-entry procedures to separate seismicity that occurs in short bursts from seismicity that has low variability in space and time. Short-term exclusions […]
New background filters
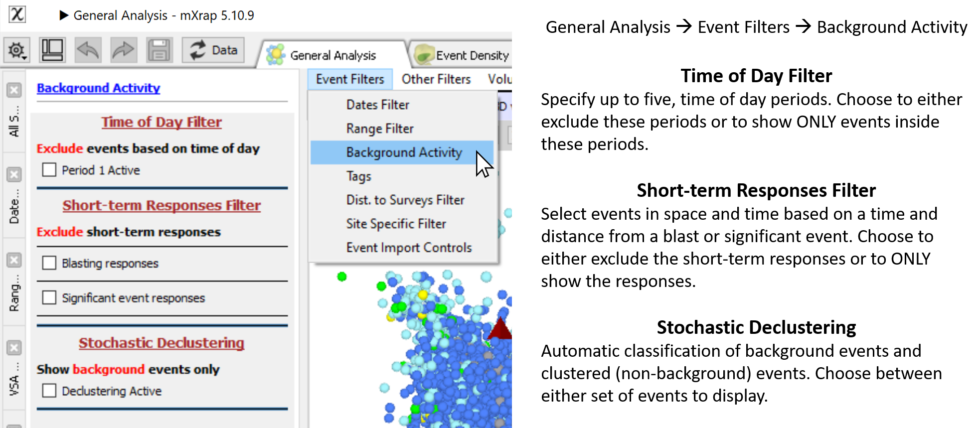
We have added some new event filter options to general analysis related to ‘background’ activity. ‘Background’ events are generally defined as having low variability in space and time. The new background filters aim to identify events that are clustered in space and time and the user can either display the ‘clustered’ or the ‘background’ component […]
Moment tensors – a practical guide
Moment tensor analysis is a topic that carries a decent level of uncertainty and confusion for many people. So I’m going to lay it out as simply as I can. For this post, I’m not going to go into too many details on how moment tensors are actually calculated. But, I’m going to summarise the […]