Analysis Window
The analysis window provides the general user interface for analysing and monitoring data with existing tools in mXrap. More than one Analysis Window can be opened all referring to the same base filter refer Base Filter.
The Analysis Window consists of the following components shown in the figure below:
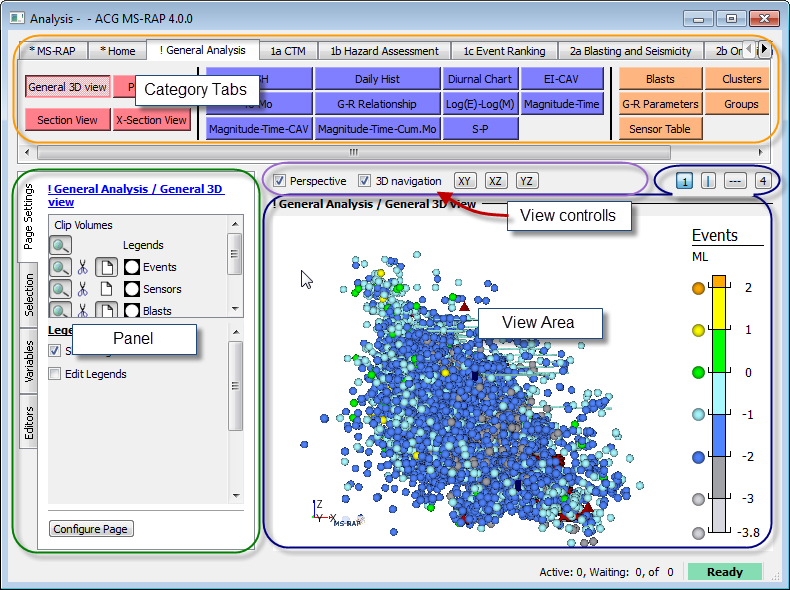

The view area provide space in the Analysis window for the user to fill with different tools (Charts/3D view/Table view). Any tool occupying the view space can be replaced by another tool by clicking on the view area to make it active, and then clicking the button of the desired tool. This will replace the existing tool occupying that space with the newly selected tool.
The total view area can be split horizontally and vertically. This option is provided by four buttons at the top right corner of the view area marked as follows:
- 1 Use the total available tool view area to display the tool (graph, table or 3D view) that is chosen.
- | Splits the available view area vertically into two sub-areas.
- --- Splits the available view area horizontally into two sub-areas.
- 4 Splits the available view area into 4 sub-areas.
The view areas are populated with a tool by selecting the view area and then the clicking on the tool button in the tools ribbon.
Each of the four multi-tool views is populated independently and navigating between them does not change the tools populating any of the multi-tool views. Which tools populate the each of the multi-tool views are saved in the Workspace. Only one instance of each tool will be active in each mXrap Analysis Window. Changes to a tool in one view will result in the same changes occurring in another view in the same mXrap Analysis Window. This same will happen with Selections applied to any tool that is duplicated in more than one multi-view in the same mXrap analysis window.
The relative size of the sub-areas assigned to each tool can be changed by dragging the horizontal and vertical line division to a desired position.
The active view area is shown with a thick black border. The name of the currently active tool is displayed above the view area. The page settings tab in the side panel displays the page settings of the tool in the active view area.


Analysis Window->Category tab: The Category tabs contained saved 2D Charts, 3D views and Table views that were created for a specific purpose. Different category tabs exist for the sole purpose of structuring the different analysis tools. The category tab gives a reflection of the chart, 3D view and table view configurations that are stored in the root folder in the folder root_folder/Settings/Category.
For more information refer Analysis Window->Category Tab->Charts/3D View/Table View
Clicking on the category tab will reveal the tools (charts, 3D views, and table views) that forms part of that particular category.
Side Panel with several side panel tabs: The side panel provides mXrap tools with which to manipulate different components of the software and consist of the following
For more information refer Analysis Window->Panel
View area: The view area is the space provided for the viewing of charts, 3D views and Table views. Four different view areas exist in each Analysis window.
For more information refer Analysis Window->View Area
Created with the Personal Edition of HelpNDoc: Free PDF documentation generator