Symbol colour scheme
Symbol-colour scheme
These markers control the range of colours and styles that are used. These can be as simple as a single style and single colour (i.e. black spheres) or more in depth with colours and styles specified for ranges of values (i.e. magnitude scale).
Use one marker only
For a single marker, marker style the 2s and 3D symbol need to be selected, along with a colour. Markers of this type is independent of any table and can be used with any dataset.
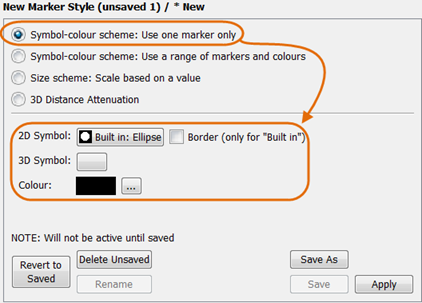
Example of a "One Marker colour scheme".
Using a range of markers and colours
When this type of marker is configured, three tabs are provides, namely a ranges, Null Marker and Blending Tab. In the ranges tab the colour and marker shape ranges are set and associated with a specific column in a table.
The input column is defined by selecting the right table and column from the column tree. The column tree consist of all tables and columns and it is therefore necessary to navigate first to the table and then further to the appropriate column.

Selection of the market input.
Setting colour and shape ranges
An auto “max row” must always exist. Multiple rows are added to form "Up to" ranges of values.
The colour and shapes defined in one line will apply to values “Up to” the value specified, starting from the value of the previous line. The first line will start from the smallest value in the dataset (Auto minimum).
For example, Up To "10" would apply that marker configuration to all points with a value less than 10. If this was followed by Up To "20", all values between 10 and 20 would be displayed by that second marker configuration.
The colour “scale” can be set to be either linear or logarithmic. These settings will have no effect if no colour ramp is used for that particular interval. When using a colour ramp the colour will be ramped linearly or logarithmically between the two boundary values.
2D and 3D symbols can be set independently. When a marker is omitted, the datapoint will not be visible in the chart or 3D view, even when Null values are plot. Built in 2D markers are limited to Charts. 3D markers uses what is referred to as sprites. The sprites are saved in the folder root_folder\points\sprites . Custom sprites can be created and used in marker styles.
Marker without any shading appear flat and it is difficult to interpret depth when using it. Depth perspective is best shown when sprites are used with subtle shading applied to it
For more information on creating your own sprites refer to Creating your own sprites.
When using a colour ramp, the colour will be changed linearly along a line between the “Start Colour” and “End Colour” as shown on the colour pallet.

Colour selection pallet.
For example, if a start colour was selected as blue and end red the colour ramp will scale from blue for the lowest values red for the highest.
The number of colours used between the lowest and highest values in the ramp can be specified. A high number will give a smooth colour ramp while a low number will give a discrete appearance.

Example of a "symbol-colour schemed" configuration.

Basic Colour ramps from right to left: Ramp from (blue) min to (red) max using 5 colours, Ramp from (blue)min to (red) 50% using 5 colours and smooth ramp from (red)50% to (blue) max, same as previous however mid portion is excluded.

Sample of 3D (also available in 2D) marker styles.
Setting the Null marker
The null marker window is identical to that of a "One Marker colour scheme". 2D and 3D markers can be selected along with a single colour. The null marker will be show for datapoints that has no value in the column on which this markerstyle is based.
Also refer Analysis Window->Panel->Page Settings
Configuring blending options
The blending options determine how the marker styles will be rendered when using pseudo volumetric rendering.
Note: Using blending will slow down 2D and 3D displays.
The transparency of the markers can be set between 0 (solid) and 100% (completely invisible). Three options are available for setting the volumetric rendering.

The blending tab in a Symbol-colour schemed using a range.

Example of transparent 3D markers.
Created with the Personal Edition of HelpNDoc: Write EPub books for the iPad