The a/b value is sometimes used as a measure of seismic hazard but there are some common mistakes made with this analysis and interpretation.
What is a/b?
The Gutenberg-Richter distribution is a statistical model that describes a log-linear relationship between the number of events, N, exceeding magnitude, M.
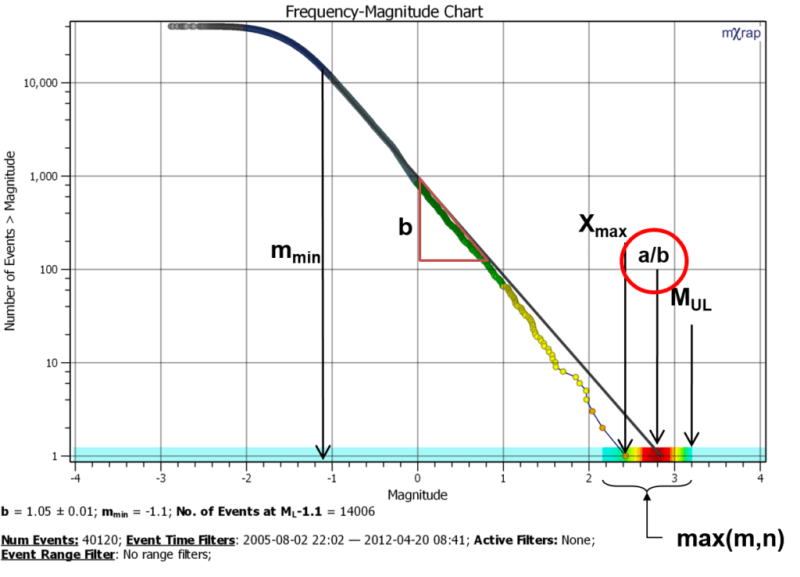
log10 N = a – bM
At N = 1, M = a/b. The figure below shows an example of a frequency-magnitude chart with the a/b value highlighted.
Does a/b mean anything?
It is important to distinguish between properties of the dataset and properties of the statistical model. The a/b value is a property of the Gutenberg-Richter statistical model but it is defined at a particular data point (N = 1). The a/b value does have some meaning, but that’s really only because the a and b value both mean something (although I’ll come back to the a-value later). In terms of seismic hazard, the activity rate and b-value are the two primary inputs required.
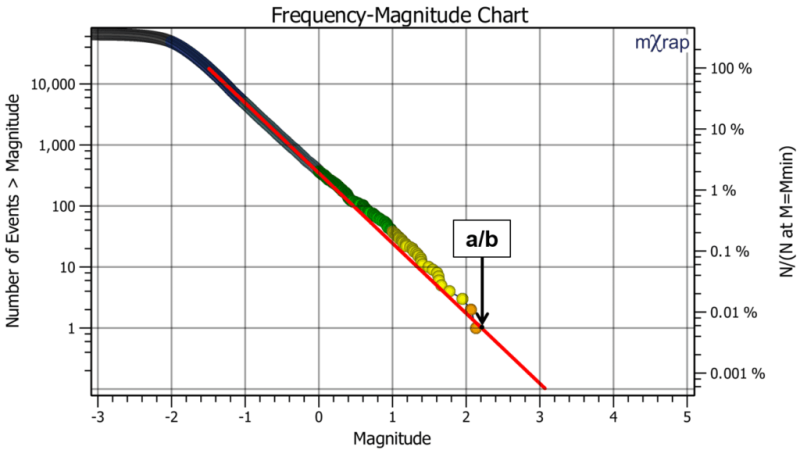
The focus on the magnitude where N = 1 is somewhat arbitrary. The statistical model describes the relative frequency for all magnitudes. It is just as valid to normalise the frequency axis to a percentage i.e. express N as a percentage of the number of events at M = Mmin. So in the figure below, at Mmin, the frequency is 100% and events over M = 1 represent 0.1% of all events over Mmin. Note the a/b magnitude represents approx 0.006% of events. So the magnitude at N = 1 loses its significance. Asking what is the significance of a/b is like asking the significance of the magnitude of the top 0.1% of events? Why not the top 0.01% or 0.001%?
The normalisation trap (or the non-normalisation trap)
The reason the a/b value doesn’t mean much for seismic hazard is because the a-value by itself is meaningless. The number of events, by itself, doesn’t tell you anything about hazard because it has no associated time and space units. It should be pretty easy to understand the importance of normalisation to regular time and space units. If I tell you there has been 100 events, you don’t know anything about what seismic hazard that represents. It could be 100 events in a very small volume, in a very small time period; this would be a high hazard. It could be 100 events in a very large volume over a very long time period; this would be a low hazard. So the important thing for seismic hazard estimates is the event rate density, i.e. the number of events, per unit time, per unit volume. Only then can you compare apples with apples.
One final point. A constant event rate density, and a constant b-value over time represents a constant hazard state. The problem is that the a/b value without normalisation is entirely dependent on how long you have recorded this constant hazard state. The total number of events (i.e. the a-value) continuously grows and so does the a/b value, even though the hazard state is not changing. This is why without normalisation, the a/b is not a measure of hazard.
If you normalise the event count based on the event rate density and a standard time and volume, the a/b value can be a measure of hazard. However, in terms of probabilistic seismic hazard, the probability that the largest event in the database will exceed the a/b value is ≈ 63%, assuming an open-ended Gutenberg-Richter distribution or a very high MUL (MUL >> a/b).
Conclusions
- The a/b value is a property of the Gutenberg-Richter model, not of the dataset
- There is no special significance to the magnitude where the Gutenberg-Richter model crosses N = 1
- The a/b value is a function of the number of events
- Without space and time information, the a/b value (and the a-value) are not indicative of hazard
- When comparing different times and zones using a/b, you must normalise using the event rate density and a standard time and volume
- The probability of the largest event exceeding a/b is ≈ 63%