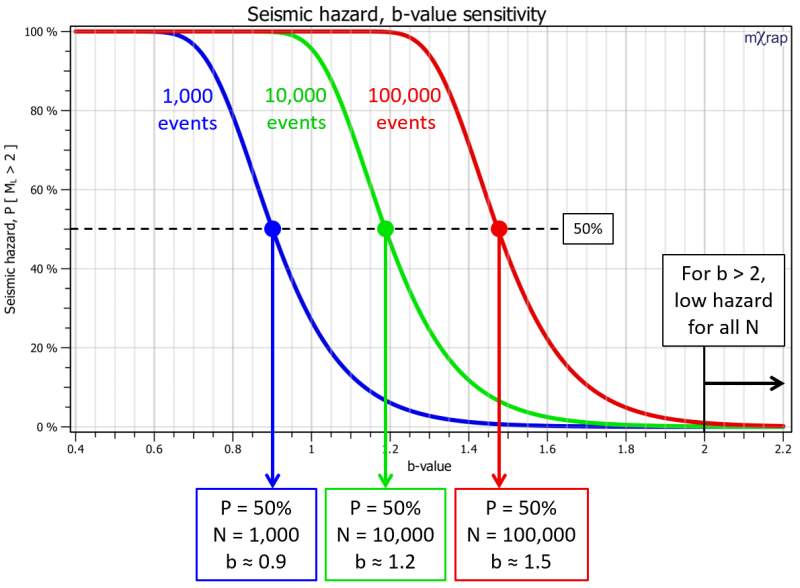
Probabilistic seismic hazard calculations are dependent on the number of events (N) and the b-value. But which has more effect on the hazard result? The chart below shows how seismic hazard varies with b-value for N = 1,000, N = 10,000 and N = 100,000.
The seismic hazard in the chart below can be considered in the following way. For a given time span and volume, if N events have been recorded, what is the probability that one of those events was above Mdesign? In this case Mdesign = ML2.
Seismic hazard increases with increasing N and decreasing b-value. Note on the chart, N = 1,000 and b = 0.9 gives the same seismic hazard as N = 10,000 and b = 1.2 (approx.). In other words an increase of 0.3 in b means you need 10 times more events for an equivalent hazard.
So, seismic hazard is very sensitive to the b-value of the area. This is important to consider when looking at daily activity rates. In some areas, 100 events may represent a very different hazard to 100 events in another area if the b-value varies.
Another point of interest in the chart is that for areas with b-values above 2, even very high event numbers represent low hazard.