- Click here to read the latest mXrap news.
- The mXrap User Case Studies for Mines Seminar will be held alongside Deep Mining 2024 in Montreal Canada. Visit the ACG events page to view upcoming courses and conferences.
Ph: (+61 8) 6488 3300
E-mail: info@mxrap.com
Visit us at
Australian Centre for Geomechanics
The University of Western Australia
Civil and Mechanical Engineering Building
Room 273, Level 2
Fairway Entrance 3
CRAWLEY WA 6009
Postal Address
mXrap development
c/o Australian Centre for Geomechanics
The University of Western Australia
35 Stirling Highway (M600)
Crawley WA 6009
AUSTRALIA
ABN 37 882 817 280

Sign up for mXrap news

The export panel, located on the right-hand side of 3D views, charts and tables, can be used to generate images,…
We’re pleased to announce the release of mXrap version 6, bringing with it a range of enhancements to elevate your…
mXrap version 5 will stop working in May. We will be transitioning everyone to mXrap version 6 before then. As…
When trying to add, delete or change blasts in mXrap, best practice is to use the ‘Blasts Editor’ found under…


- All
- Backfill
- Basic Seismic Monitoring
- Caving
- Chart of the Day
- Damage Mapping
- Developer
- FAQ
- General
- General Analysis
- Grid Based Analysis
- Large Event Analysis
- mXsync
- Playground
- Rock Mass Data
- Seismic Hazard
- Short-term response analysis
- Source Parameters
- Support
- Tips and Tricks
- Training
- Uncategorized
- Updates
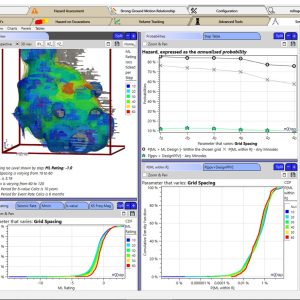
A new window has been added to the Hazard Assessment app (Figure 1). The sensitivity analysis aims to quantify the effect of the variation of the input parameters on the hazard. These analyses can also help the user to determine the optimal settings to use for many of the parameters. This window allows the user […]

mXrap Developer Updates – August 2023 If you would like to access these updates and require a root upgrade, please contact the support email address for assistance.
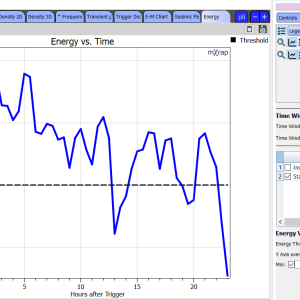
There have been a number of recent updates to the Short-term Response Analysis app. These include: Chart for determining re-entry using different parameters: This chart gives you values for a particular parameter over time (based on a user-defined time window size and step). A threshold value for that parameter can be set, allowing you to […]