As part of the ACG’s Ground Support Guidelines for Rockburst Prone Conditions research project, we have developed an application for damage mapping. It is a web-based application design for use with a tablet. This allows users to do their damage mapping offline while underground on the tablet, then when the tablet is connected to the network, the information is synced with our server and pulled into mXrap (making it a single pass process).
Each damage mapping instance is stored as a separate report. Within each level plan, mine development is segmented into short lengths (approximately 5m) called ‘Tracks’. Information is stored on each of these tracks, to allow the history of each underground location to be monitored.
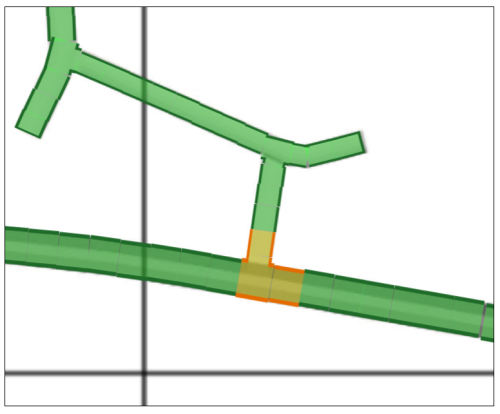
Tracks in damage mapping web application. Tracks shown in orange are selected for use in the current report
Data collected for each track includes:
- Location co-ordinates
- Location name
- Corrosion
- Water
- Excavation height/span
- Rock Mass Characteristics
- Installed Ground Support
- Falls of Ground
- Photos
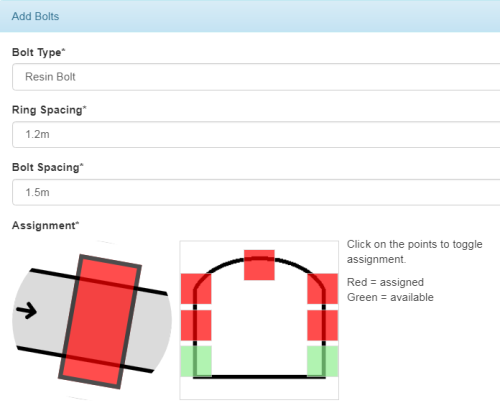
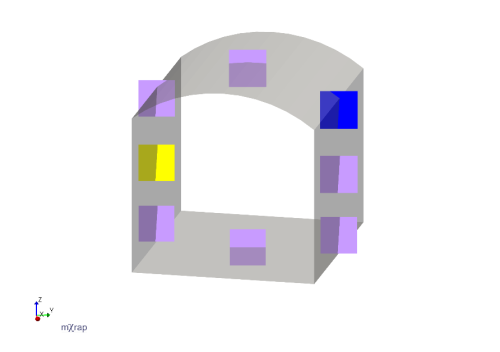
Assigning ground support in web application
In addition to this information, damage data is also collected with more detail at each point on the profile (backs, shoulder, walls and floor). Damage information is captured in terms of both broad damage scales (i.e. rock and support damage scales) and detailed observations of individual support element damage. In addition to damage data, information on locations which have not been damaged can also be captured.
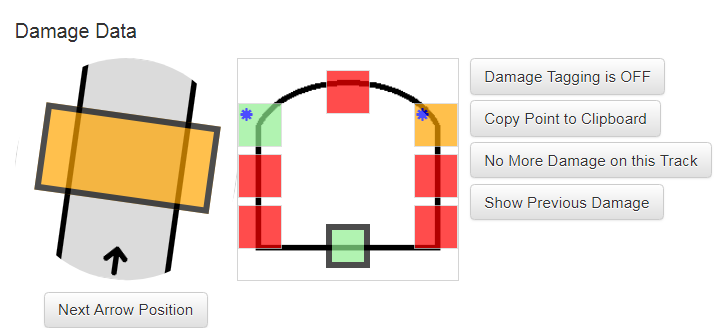
Damage data on different points on the profile of the drive (web application)
The application focuses on damage mapping for rockburst occurrences, however will soon be expanded to cater for routine damage mapping, with a site specific configuration allowing mines to choose which information to capture for day-to-day damage mapping.
Once the damage data has been synced into mXrap, the mXrap app is used for visualisation and analysis. The basic viewer window operates in a similar manner to the general analysis 3D view. Users can view and filter their damage locations and colour them by different parameters. Seismic events, blasts etc. can be seen and filtered simultaneously.
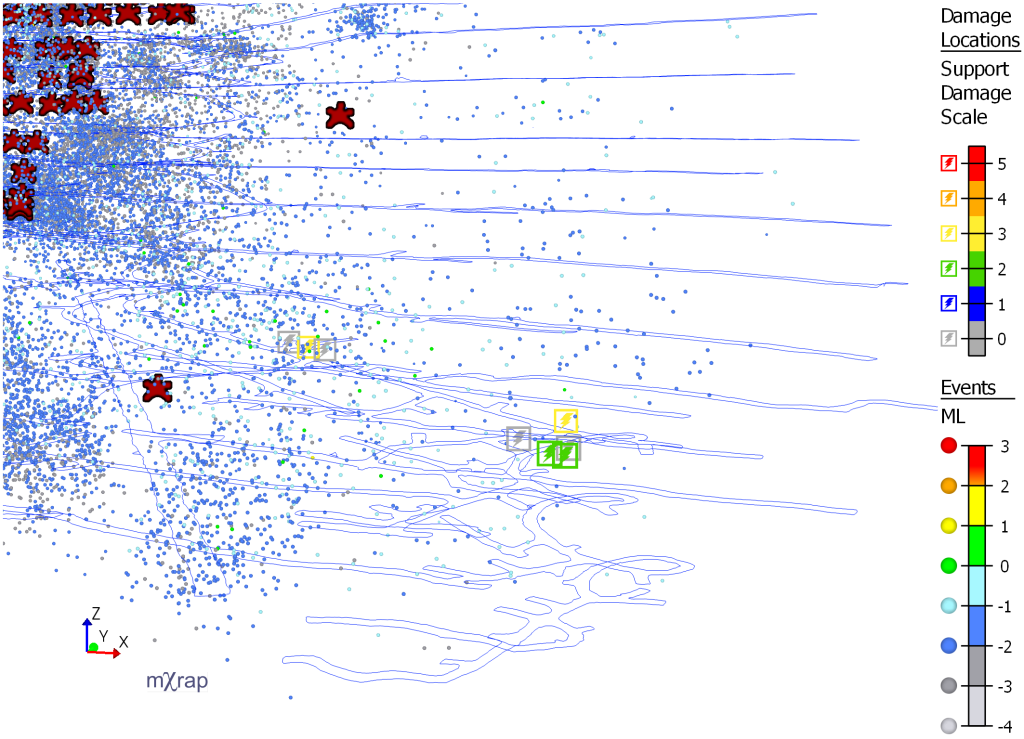
3D view showing damage locations coloured by Support Damage Scale (mXrap application)
The user can also select individual tracks/points and see the more detailed damage data that was entered.
Points on profile showing damage (mXrap application)
This includes photos, which allows users to easily organise their photos so that they can look at photos from a specific location underground over time.
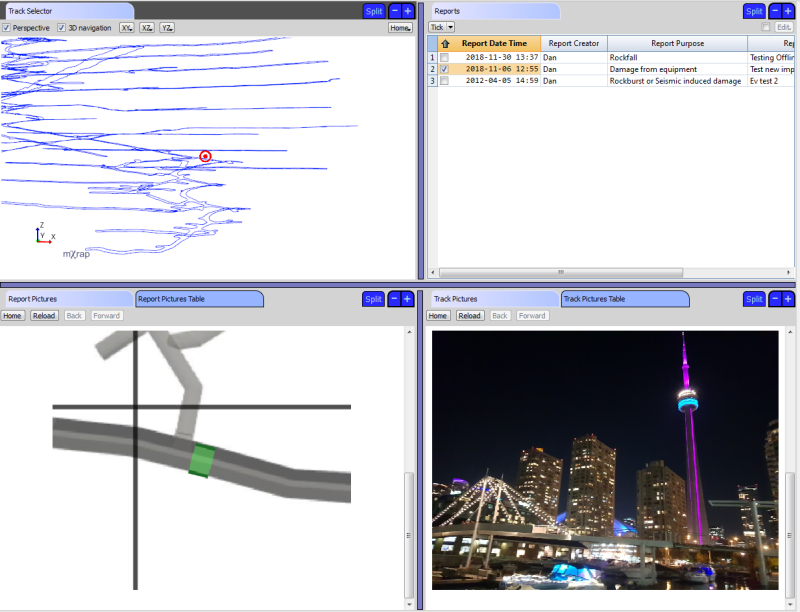
Photo viewing window in mXrap application