A new window has been added to analyse seismicity in the Large Event Analysis application. In a similar approach to the Short-term Response Analysis app, events are assigned to large events based on a spheroid volume and a time range before and after the large event.
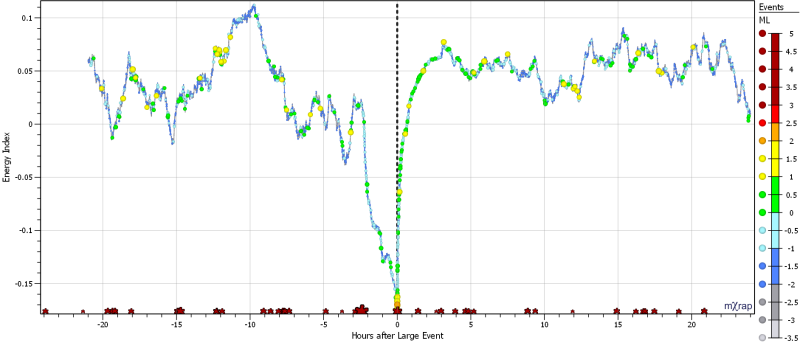
The chart below shows the energy index of seismicity for 24 hours before and after 156 large events. The time of the large event is indicated by a vertical, dotted black line. If a large event had a blast or another large event in the previous two hours, it was not included. The time of the most recent blast and large event, within the spheroid volume, is listed in the table to be excluded from the analysis if required.
There are other chart options available to show individual large events (rather than stacked) or to show different seismic parameters (other than energy index):
-
- Cumulative number of events
- Cumulative seismic moment
- Cumulative apparent volume
- Activity rate
- Apparent stress frequency
- b-value
You can also copy the current seismic events filter into the general analysis window to use the full range of charts and tools.
If you would like to arrange a root upgrade to get the latest applications, please contact us at our support email address.