The Rock Mass Data Analyser (RMDA) application allows a user to import various types of geotechnical data (rock mass quality, structural, stress and intact rock strength) into mXrap, creating a geotechnical database which may be visualised and analysed in 3D, on charts and in stereonets (see previous blog post for more details).
Since the release of the RMDA, various updates have been made to assist with data analysis and setting up the rock mass database.
Interface:
The application is now split into two apps: the Rock Mass Data Importer and the Rock Mass Data Analyser. This has been done to streamline the data import process and allow users to focus on data analysis in the analyser application.
Geology:
Geology logs may now be imported into the application. These logs can be used to update other borehole databases (e.g. geotechnical logs, structural logs, etc.) with lithology data. Lithology groups may also be created, allowing for the grouping of lithologies from geology logs into broader groups that are more suited for geotechnical purposes.
Structures:
- A digital mapping data section has been introduced, where structural data from photogrammetry and LiDAR scans may be imported. This data may be combined with structural data from boreholes and scanline mapping, contributing to the structural database.
- True spacing statistics for each defined discontinuity set has been added (note that discontinuity sets may be outlined in the application).
- Users can now visualise and correct for orientation and sampling biases.
- Alpha and beta values imported from structural logs can now be converted to dip and dip direction, where the user is required only to provide details on how the beta angle was measured. A core stick illustration is also provided to assist with choosing a beta measurement option.
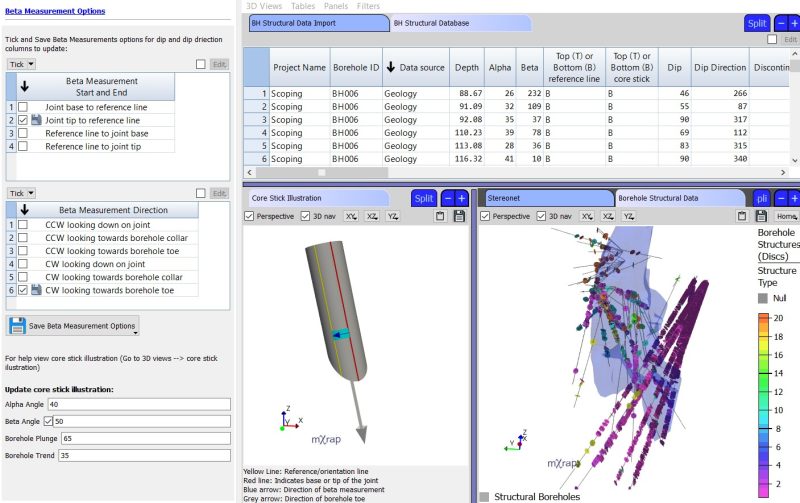
borehole structures where dip and dip directions have been calculated from alpha and beta values
Stress:
A section to visualise and assess stress data has been added to the application. Borehole stress measurements and borehole breakout observations can now be imported, allowing for the creation of a stress database which can be updated as required.
Tools in this section allow a user to:
- Visualise stress data along boreholes.
- Visualise the orientation of principal stresses.
- Analyse stress orientations with respect to depth below the surface.
- Calculate the Euclidean mean of the stress measurements.
- Produce a summary report.
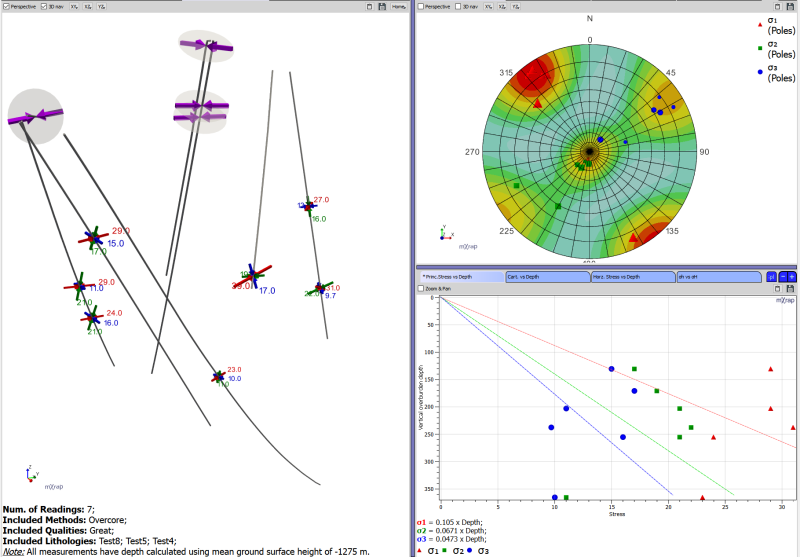
stress data window
Other updates:
- Various new filters and markerstyles have been added. This includes a structure type filter for structural data and a failure type filter for intact rock strength data.
- VSA Filters have been added for all data sources. This allows the filtering of data based on a given user defined volume.
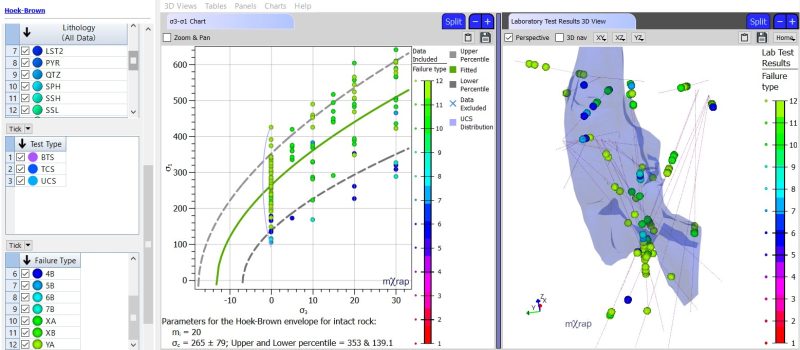
Intact rock strength window with “failure type” filter applied to data in the Hoek-Brown chart and 3D view
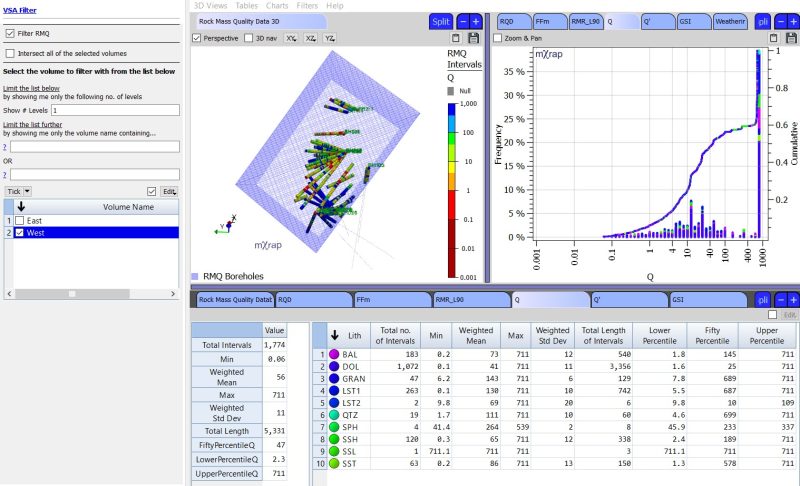
VSA filter applied to rock mass quality data
Future plans for the RMDA application include the development of tools to define and edit geotechnical domains interactively. There are also plans to continue to integrate the RMDA into other mXrap applications.
For more information or if you would like to try the RMDA application, please contact our support email address